

Written by The Kaiko Research Team
All research is powered by Kaiko data.
Trend of the Week
DENCUN UPGRADE FAILS TO BOOST PRICES.
The Ethereum network just underwent a major upgrade known as Dencun, designed to significantly lower transaction fees for Layer 2 solutions and boost scalability. The upgrade completed without a hitch, but prices for both ETH and Layer 2 tokens have since collapsed amid a wider market sell-off.
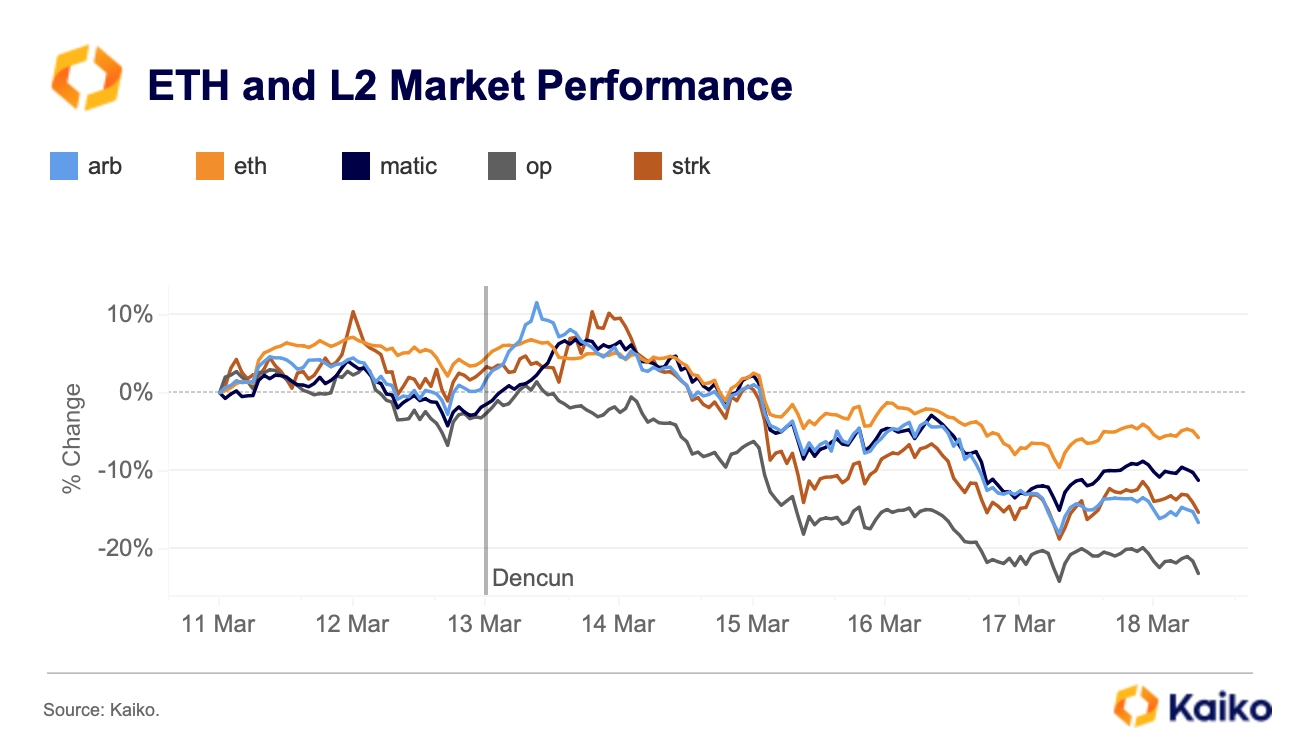
Ever since the Merge upgrade in September 2021, ETH has significantly underperformed BTC despite predictions of a “flippening,” a moment in which Ethereum’s value would flip Bitcoin’s. More recently, ETH has underperformed SOL, the native token of the Solana network, which at one point seemed on the verge of collapse but is now an increasingly formidable competitor in the Layer 1 space.
While token prices are not everything, they can be considered a decent proxy of support for a network.
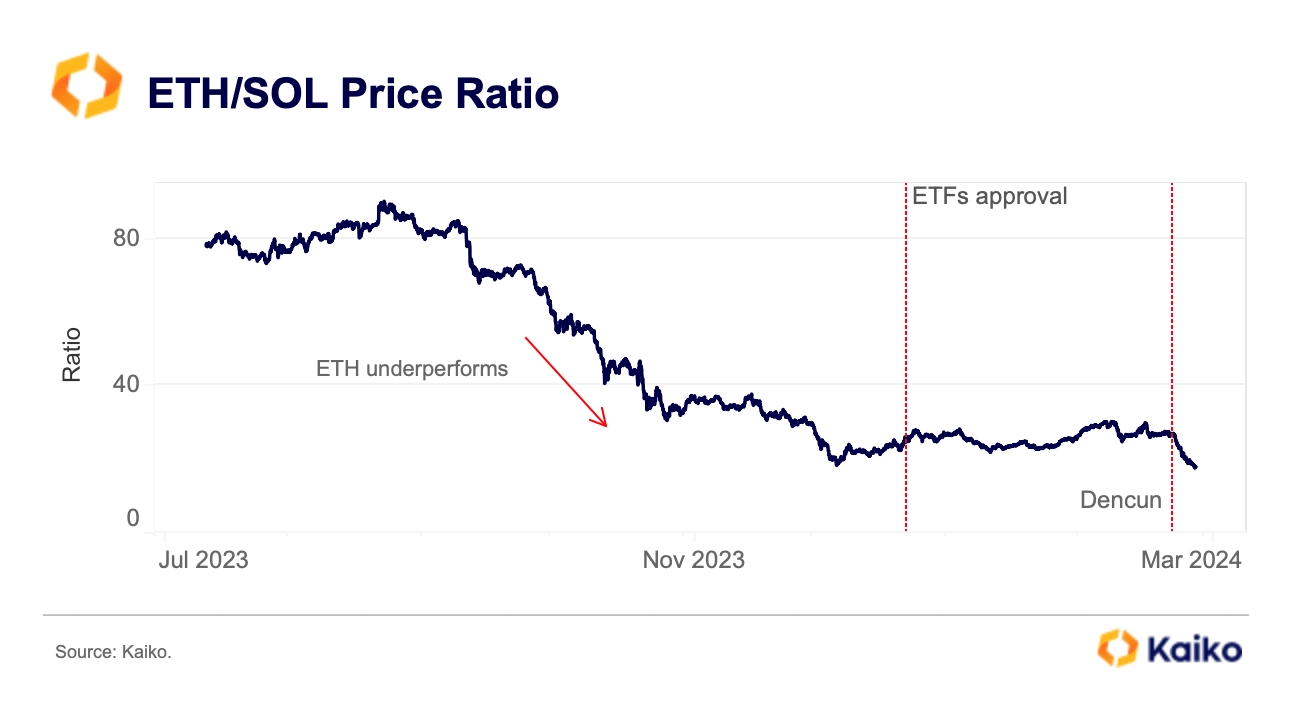
The good news is that while prices are still underperforming some other Layer 1s and BTC, ETH trade volume has surged which suggests traders are back in full force. Volumes are currently at multi-year highs above $10bn a day.

While Dencun hasn’t yet generated price returns, it appears to have successfully lowered Layer 2 transaction fees which is a huge step for the network.
Data Points
THE ALAMEDA GAP IS NO MORE.
The ‘Alameda Gap’ — the gap in liquidity left after the collapse of FTX and its sister company Alameda — persisted for more than a year as market makers waited on the sidelines for sentiment and trading activity to recover. However, as of last week, market depth has almost fully recovered and is back to its pre-FTX average.
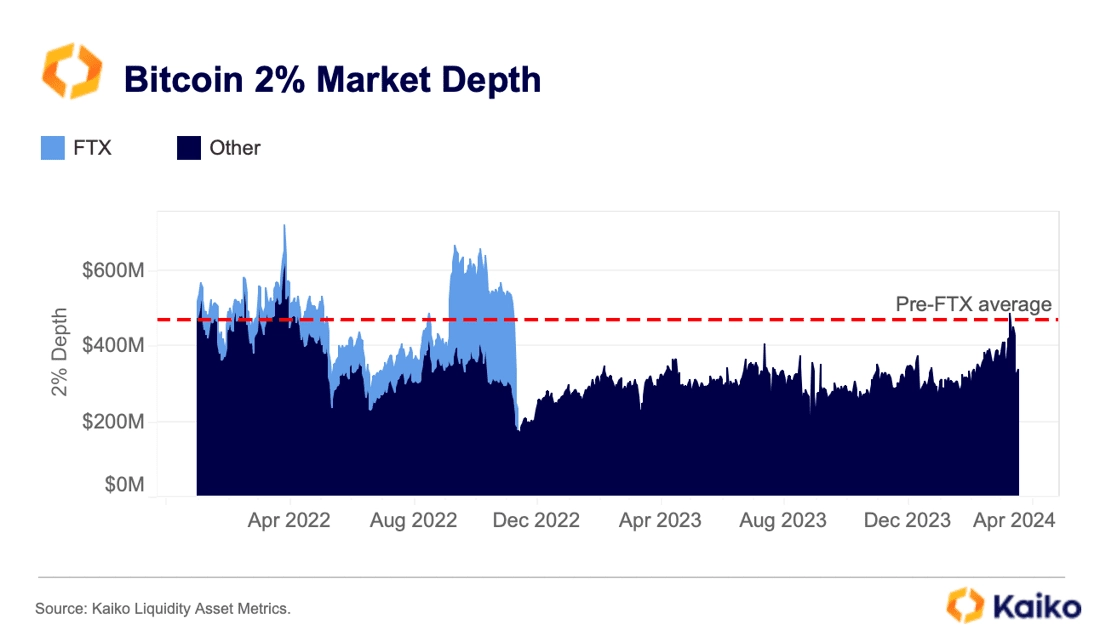
Bitcoin 2% market depth (denominated in USD) has been rising YTD, and briefly surpassed its pre-FTX average of $470mn last week. Much of this increase can be attributed to the surge in BTC prices which rose at a faster pace than liquidity since the ETF approvals.
Looking at BTC-USD spreads on the three major U.S.-available exchanges —Coinbase, Kraken and Bitstamp — the cost of trading has also declined, suggesting liquidity conditions are meaningfully improving.
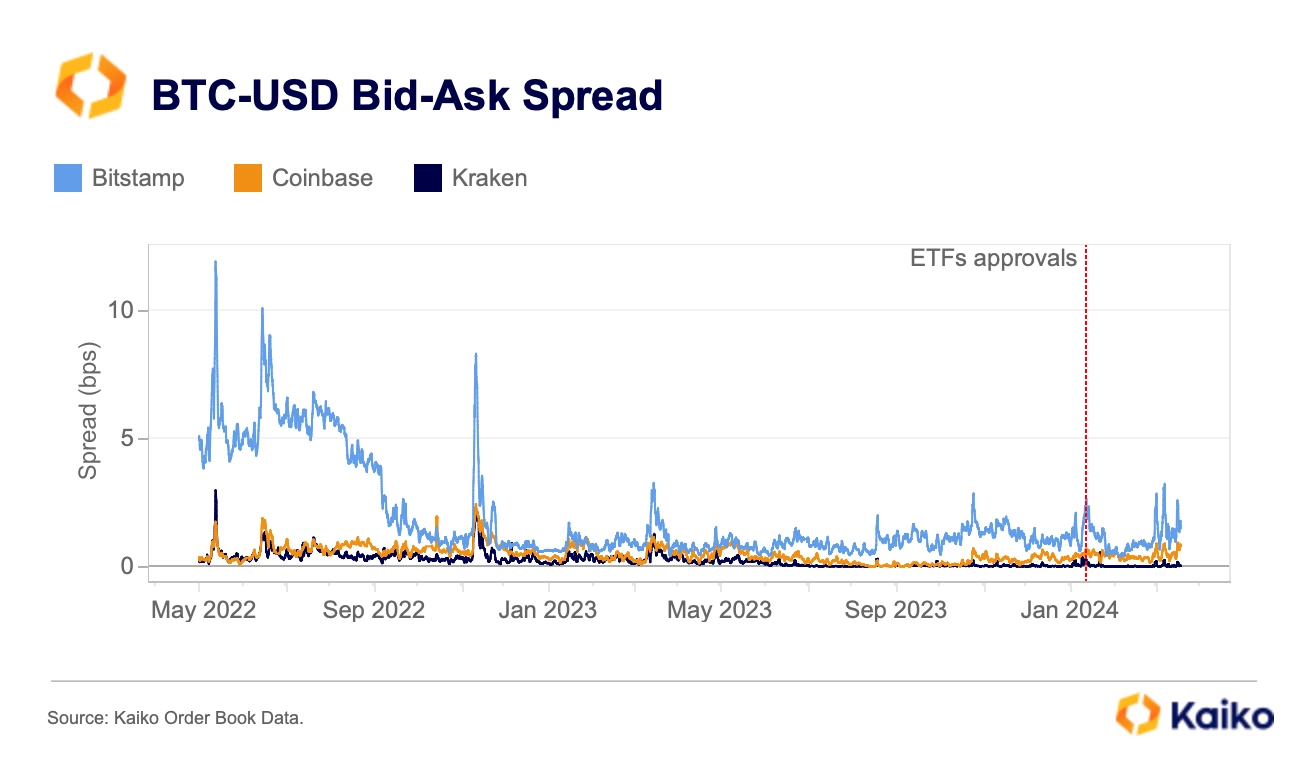
The change in spreads could partly be due to structural reasons. Spreads more than halved on Bitstamp from as high as 10bps in 2022 to below 5bps currently after the exchange changed its fee model from a “flat fee” to maker/ taker model, where makers pay zero or little fees and are incentivised to provide liquidity at a lower cost. BTC-USD spreads on Kraken and Coinbase are also down.
BINANCE’S RELIANCE ON ZERO-FEE TRADING IS INCREASING.
Binance’s zero-fee trading pairs are approaching 40% of total volume, its highest level since March 2023, when the exchange removed its large-scale zero fee promotion campaign for 13 BTC trading pairs.
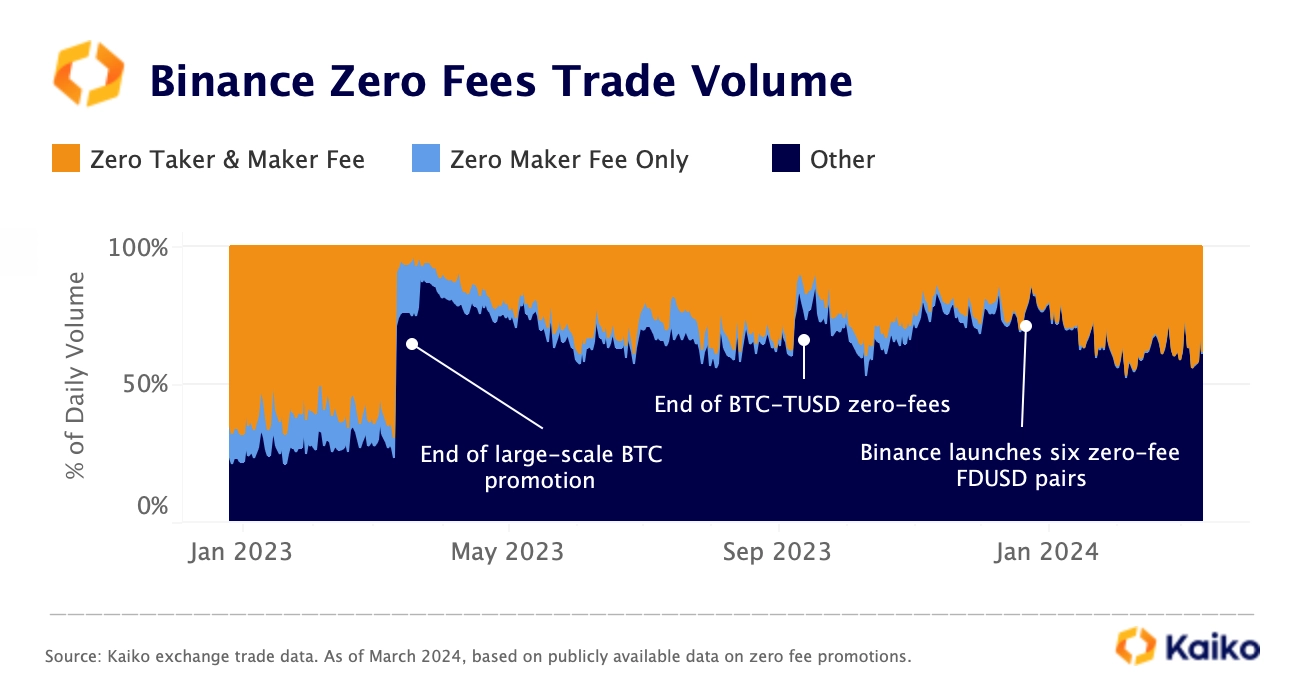
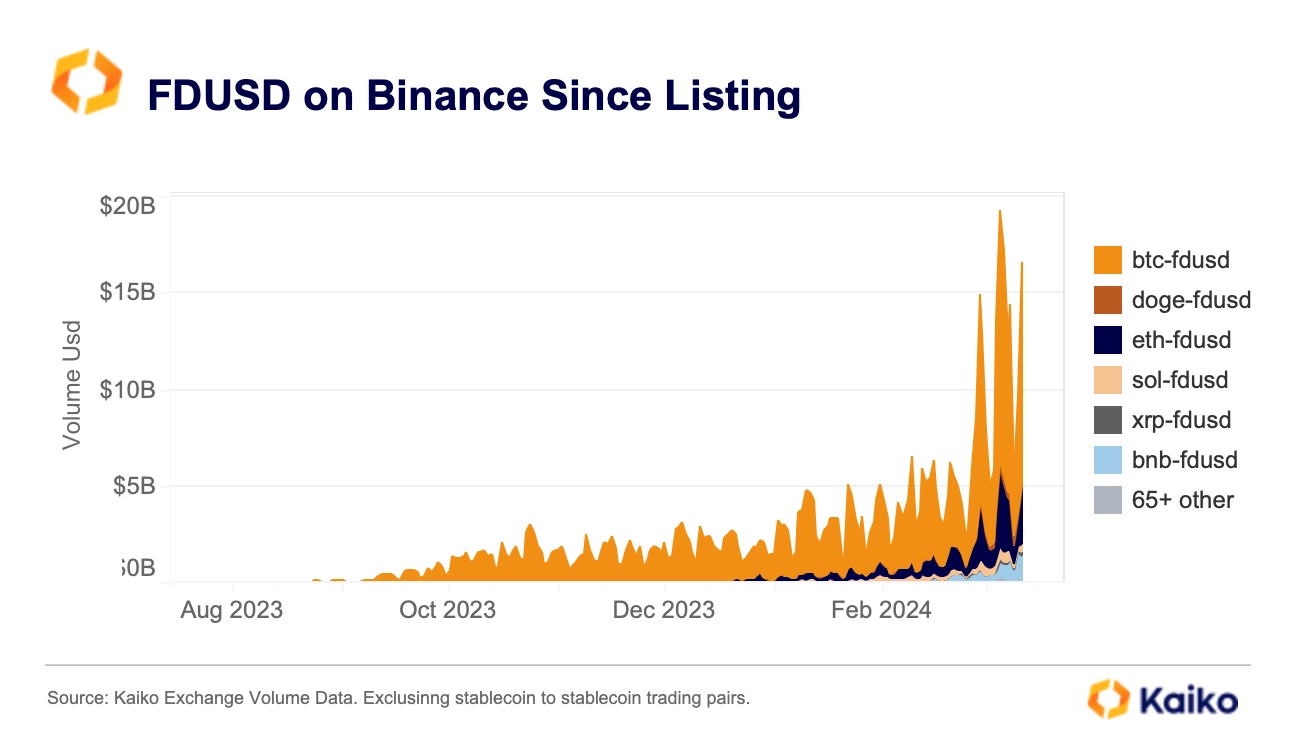
The increase has been driven by rising FDUSD volumes, a stablecoin traded solely on Binance and which has benefited from a number of zero fee promotions since its listing in August. Binance currently offers 17 zero-fee trading pairs out of which 7 include FDUSD as the base or quote asset.
In 2024, FDUSD has emerged as the second largest stablecoin by trade volume on centralized exchanges with a market share of more than 20% and average daily volumes of $6bn. Nearly all of the FDUSD is traded on Binance without fees.
However, despite surging trade volumes FDUSD trading pairs have significantly higher bid-ask spreads relative to usdt-quoted pairs, especially for some altcoins.
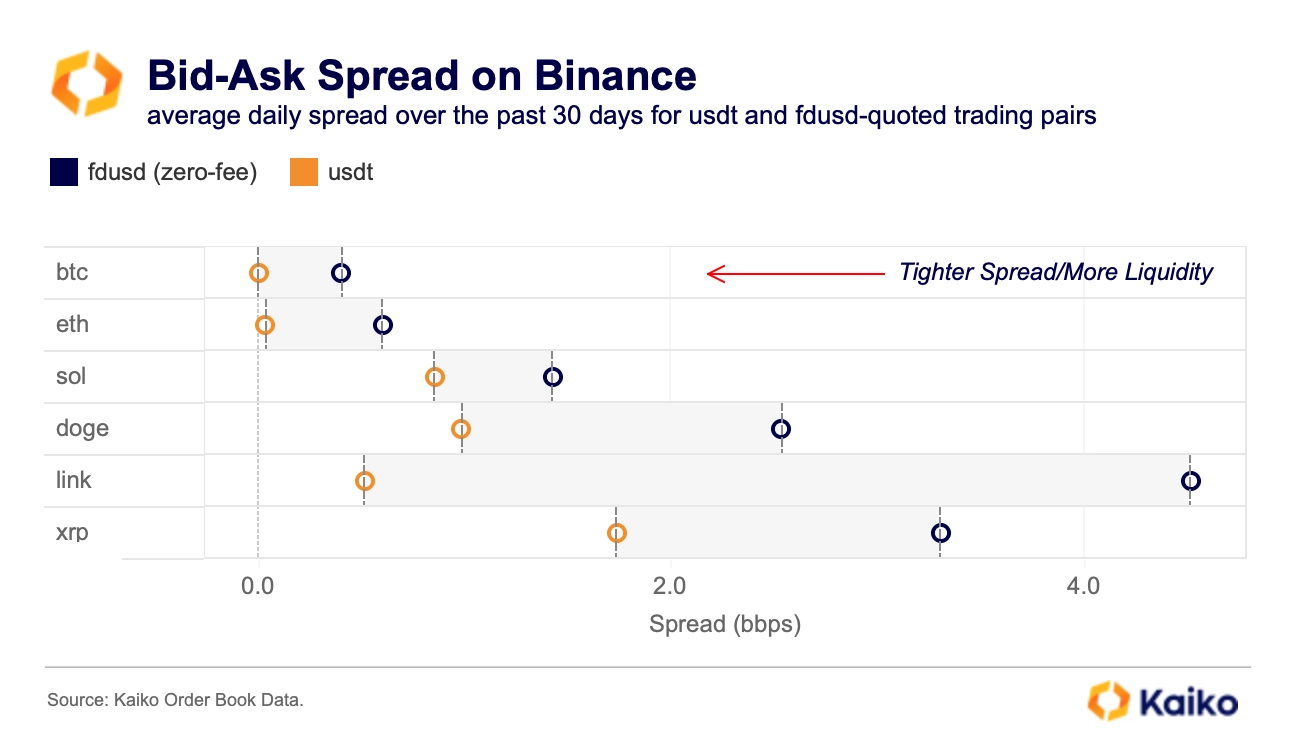
This suggests that these pairs are less liquid and more costly to trade relative to non zero fee pairs and struggle to attract liquidity.
WILL BITCOIN REPLACE GOLD?
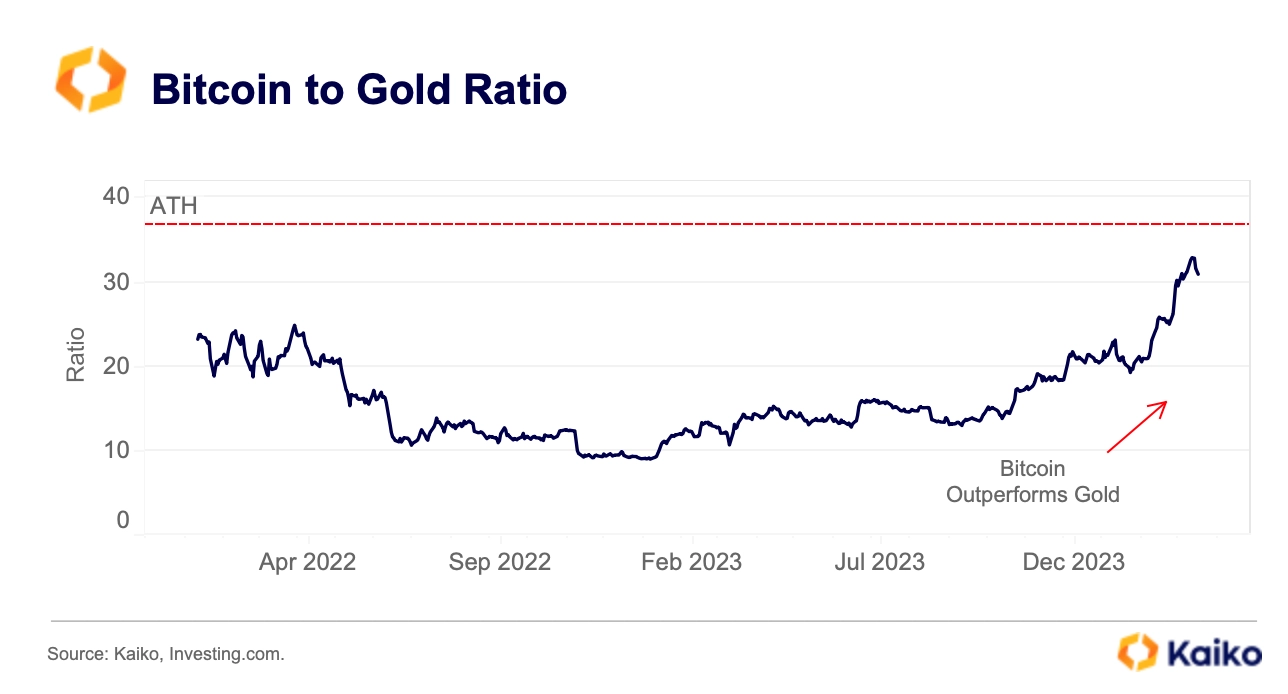
The Bitcoin to gold ratio, measuring the two assets’ relative performance, is inching closer to its all-time high last hit in November 2021. The increase shows that BTC is outperforming gold, despite both assets hitting all-time highs over the past few weeks. In addition, while bitcoin ETFs have attracted $11bn since launch in early January, the largest physically-backed gold ETFs – SPDR Gold Shares (GLD) and iShares Gold Trust (IAU) registered outflows.
So are we shifting towards a new global store of value? Over the past decade the two assets have been mostly uncorrelated which could suggest that the drivers of gold demand have been different from Bitcoin’s.
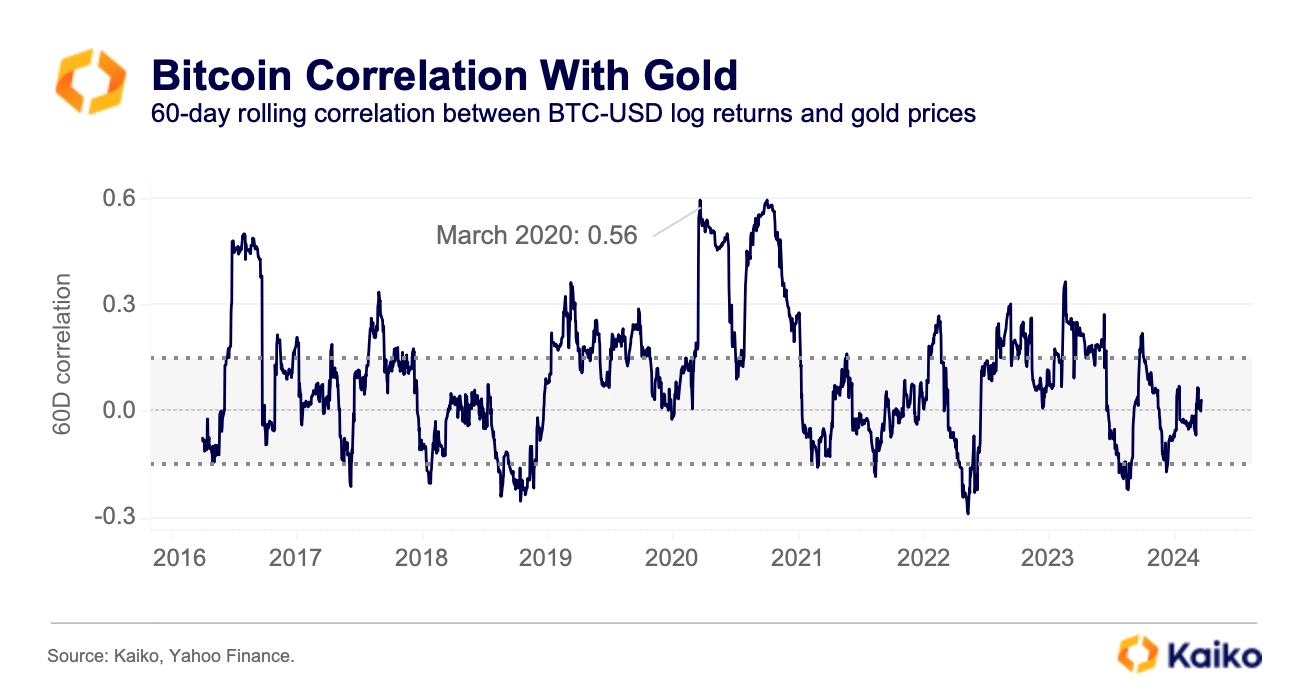
The 60-day BTC/Gold correlation oscillated between a positive 0.15 and a negative 0.15 most of the time. A notable exception is the period in the aftermath of the COVID market crash in 2020 when correlation hit an all-time high of 0.56.
While the new spot BTC ETFs are pitched as a complement or even a replacement of gold in investment portfolios, demand for gold has been mostly driven by global central banks in recent years.
BINANCE FACES FX RATE MANIPULATION PROBE IN NIGERIA.
Last month, Nigeria restricted access to several crypto platforms and launched a foreign currency probe against Binance accusing the exchange of devaluating the Nigerian Naira (NGN) and enabling an illicit flow of funds. The move follows a 70% decline of the NGN over the past eight months.
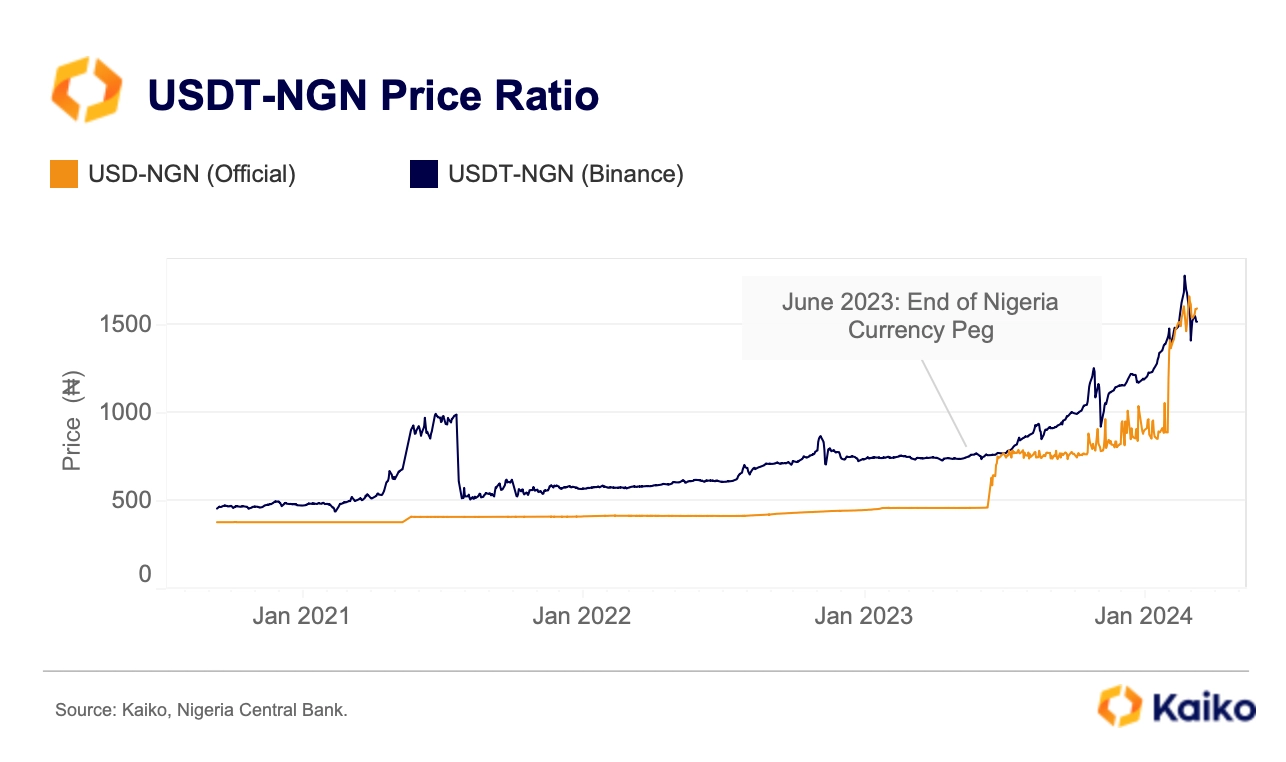
Back in 2021, Binance delisted most Naira trading pairs following regulatory pressures from the Nigerian Central Bank. Users were still able to exchange NGN for USDT and BTC and trade via Binance’s peer-to-peer (P2P) platform until recently. The price of USDT quoted in NGN on Binance has been on average 30% higher than the official central bank exchange rate — a price closer to the parallel USD exchange rate.
For years, Nigeria has maintained a fixed exchange rate regime in an attempt to avoid the devaluation of the NGN which faced downward pressures due to the country’s sinking oil revenues. However, in June 2023 the country surprisingly ended its official currency peg of 461 Naira to the Dollar, hoping the move will boost foreign investments.
This caused the Naira to depreciate sharply, bringing it closer to the market rate, and inflation to soar to 30% as import prices increased.