Where Did Weekend Crypto Traders Go?

All research is powered by Kaiko data.
WHERE DID BITCOIN WEEKEND VOLUME GO?
Weekend and overnight liquidity management has always been a challenge for 24/7 crypto markets, creating a mismatch between the operating hours of traditional financial institutions and the needs of large crypto traders and market makers.
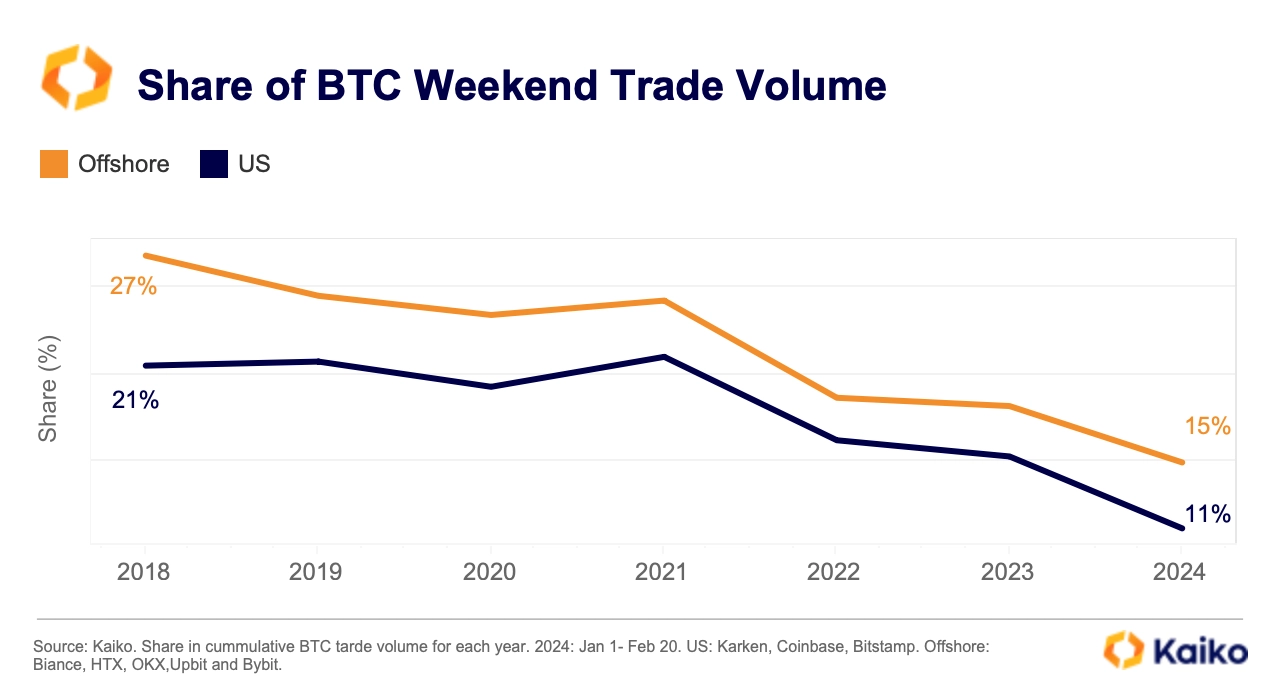
The March banking crisis exacerbated this mismatch after two of the main crypto-friendly banks in the U.S. shuttered. However, this trend has been long-coming: the share of BTC traded on weekends has declined significantly over the past six years, dropping from 24% in 2018 to just 17% in 2023. The decline suggests worsening liquidity conditions during weekends and could be explained by both increased institutional participation and worsening market infrastructure.
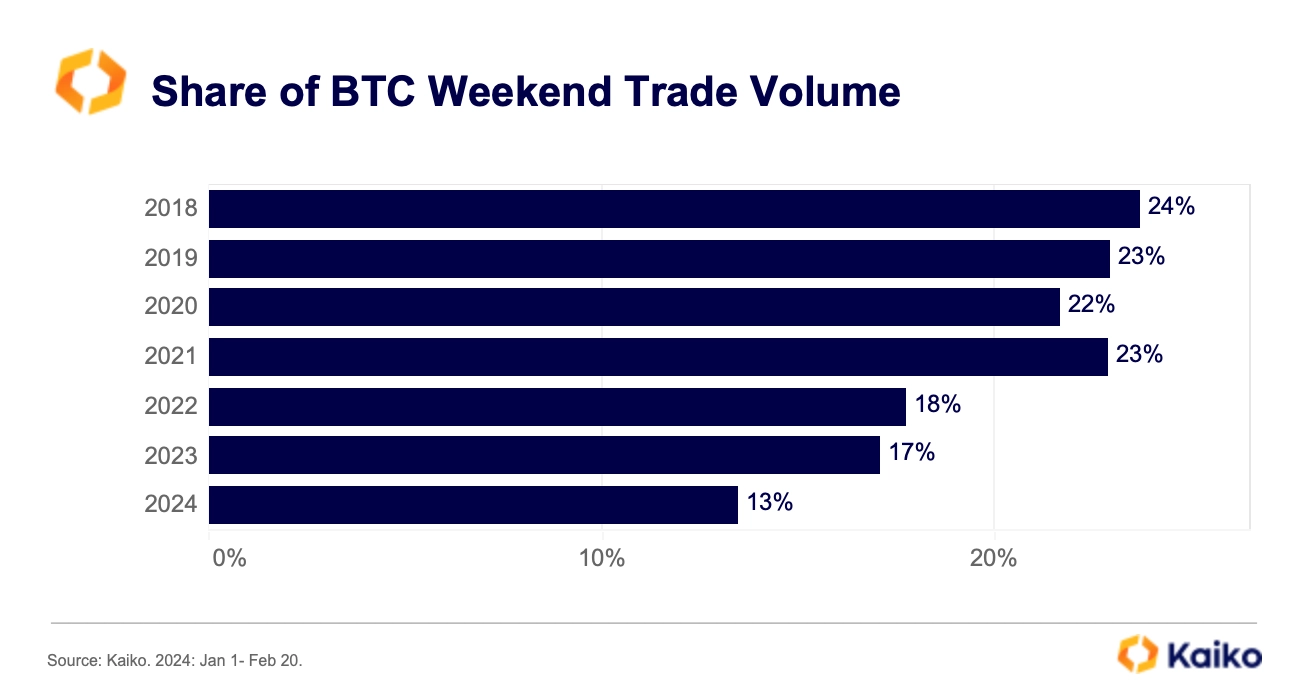
So far in 2024, just 13% of all BTC transactions between January 1 and February 20 were executed over the weekend. Breaking this down by region, weekend trading has declined on both offshore and U.S.-available exchanges. Interestingly, weekend trade volume has historically been higher on offshore markets, suggesting increased retail participation.
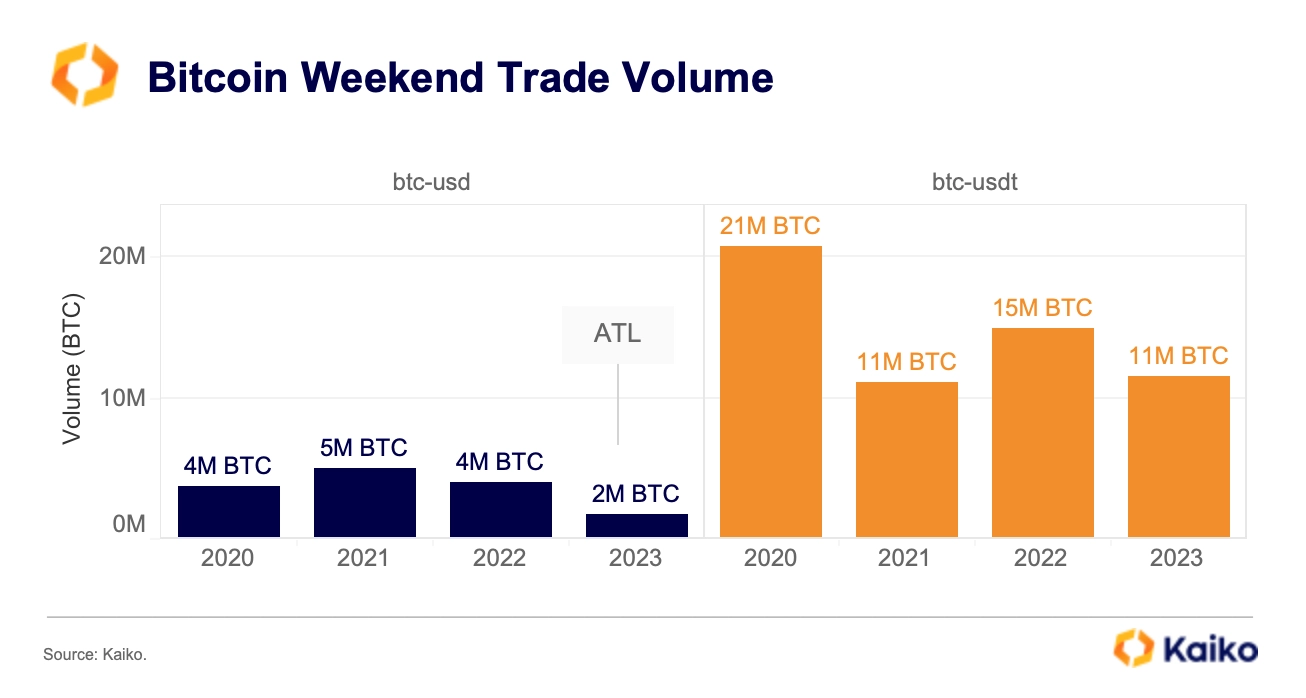
Looking at the cumulative trade volume for the two most liquid BTC trading pairs, the decline has been more pronounced on BTC-fiat markets. BTC-USD weekend trade volume hit an all-time low in native units last year.
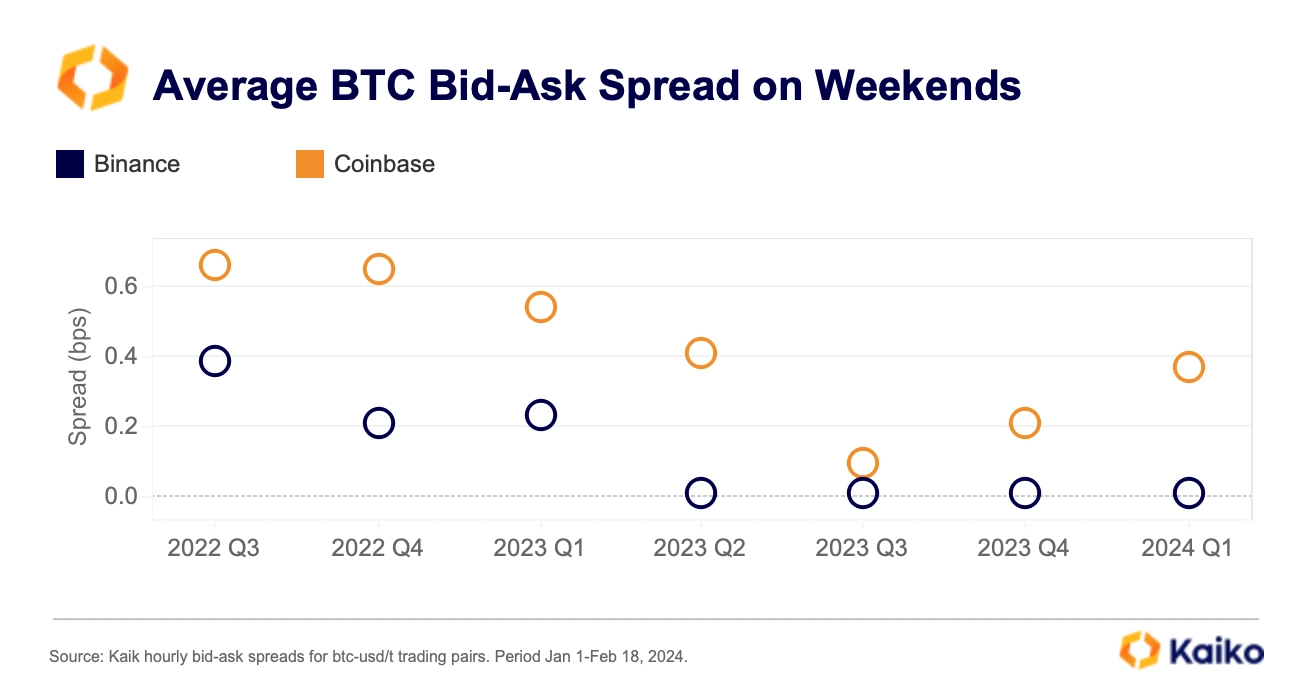
We observe poorer liquidity conditions on Coinbase over the weekends compared with Binance. The average bid-ask spread — which measures the cost of trading — has widened on Coinbase since Q2 2023 suggesting weekend liquidity has worsened. In contrast, it narrowed slightly on Binance over the same period.
The good news is that Bitcoin liquidity has rebounded following the launch of spot ETFs in the U.S. with market makers increasing their positions on U.S.-platforms. However, our analysis of the on-chain ETFs dynamics showed that almost no transfers between issuers and exchanges took place on weekends.
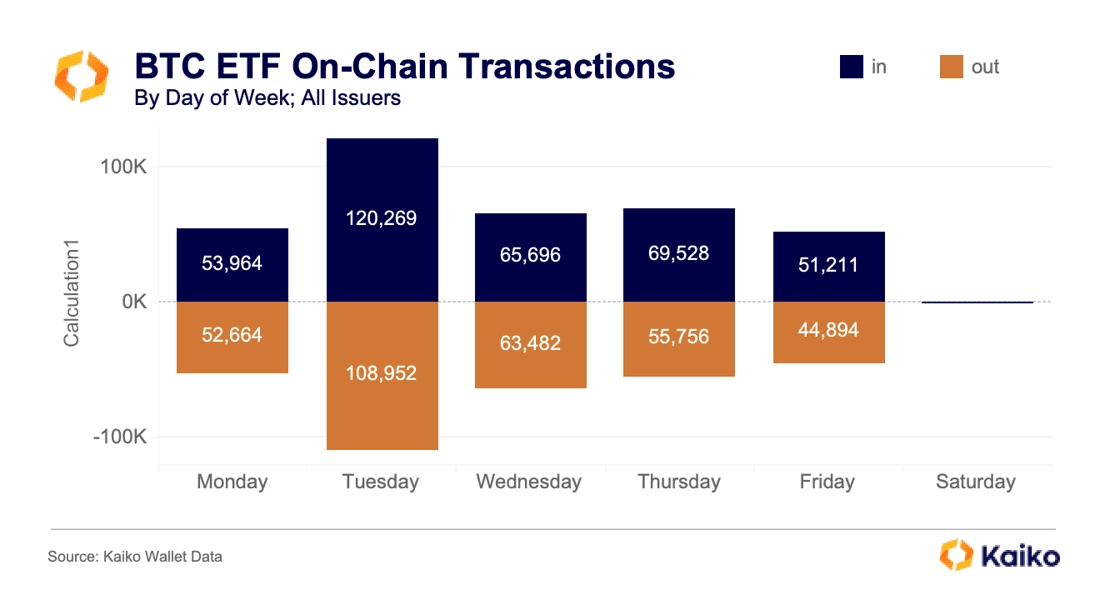
This suggests that the gap between weekends and weekday could deepen further as ETFs gain traction and change the market structure.
Data Points
AI-TOKEN TRADE VOLUME HITS ALL-TIME HIGH.
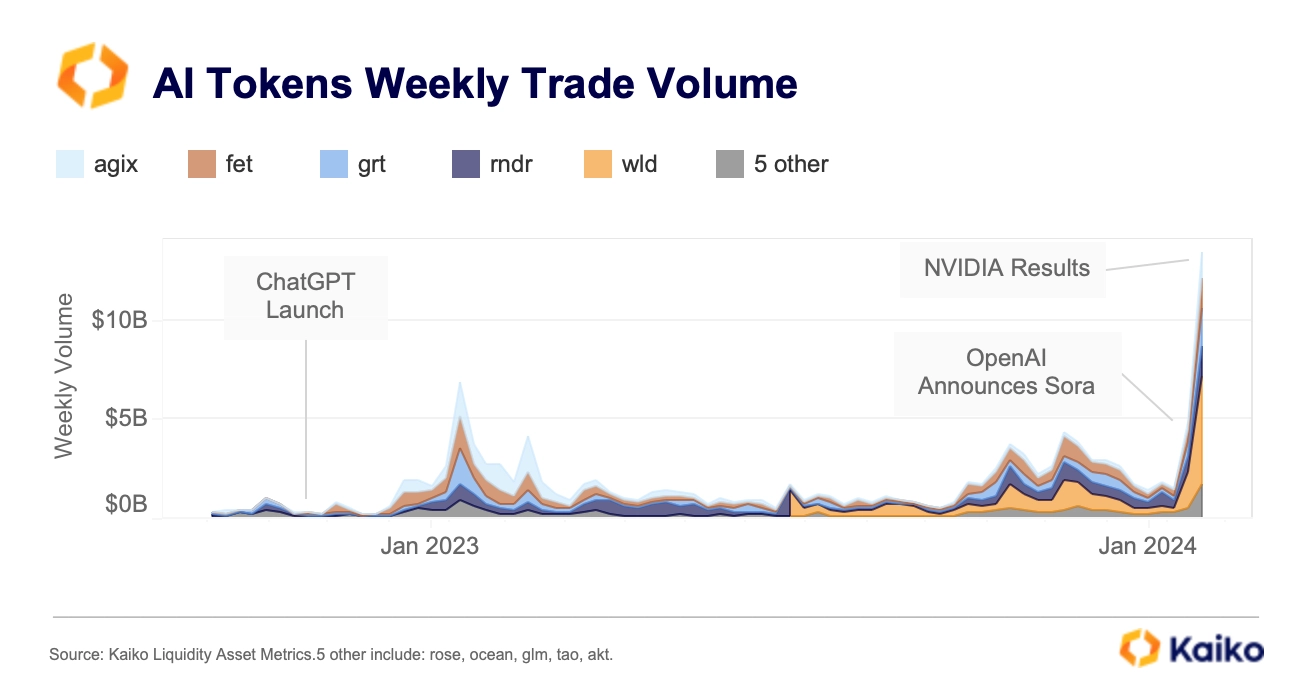
The weekly trade volumes of the top AI tokens by market capitalization hit an all-time high of $13bn last week, led by Worldcoin’s WLD. The surge comes on the back of record revenues for chip maker Nvdia, which contributed to a wider stock market rally.
AI-related crypto tokens are linked to projects that use artificial intelligence as a tool to improve security, user experience, power decentralized exchanges, or image and text generation services. They have outperformed Bitcoin by a large margin this year with average returns of over 105% YTD compared to 22% for BTC.
While Binance is still the largest market for AI tokens, its dominance has declined significantly over the past year, with exchanges such as Poloniex, OKX, and HTX, as well as U.S. exchanges seeing growing trading activity.
IS ETH FINALLY CATCHING-UP?
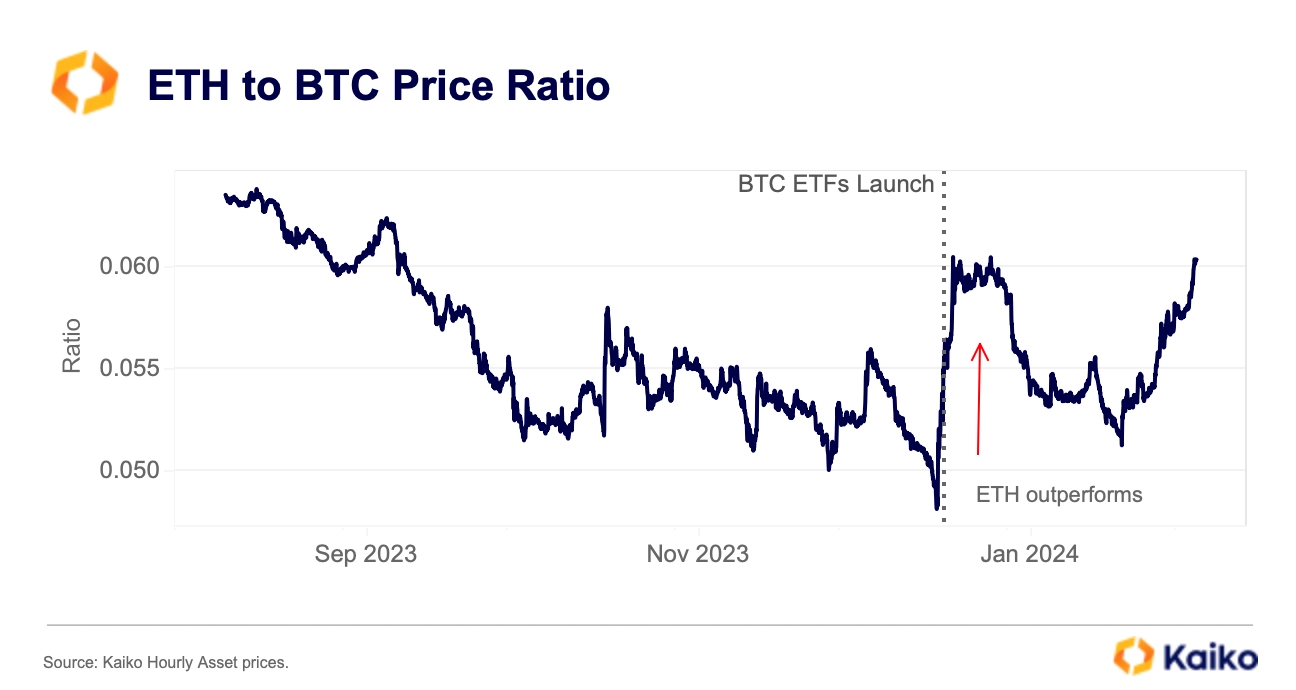
Last week, the ETH to BTC ratio — measuring the relative performance between the two assets — rose to its highest level since early January as ETH briefly traded above $3k for the first time since April 2022. The ratio has been volatile this year, surging to a multi-month high of 0.6045 on January 12, before falling back to 0.5125 in early February.
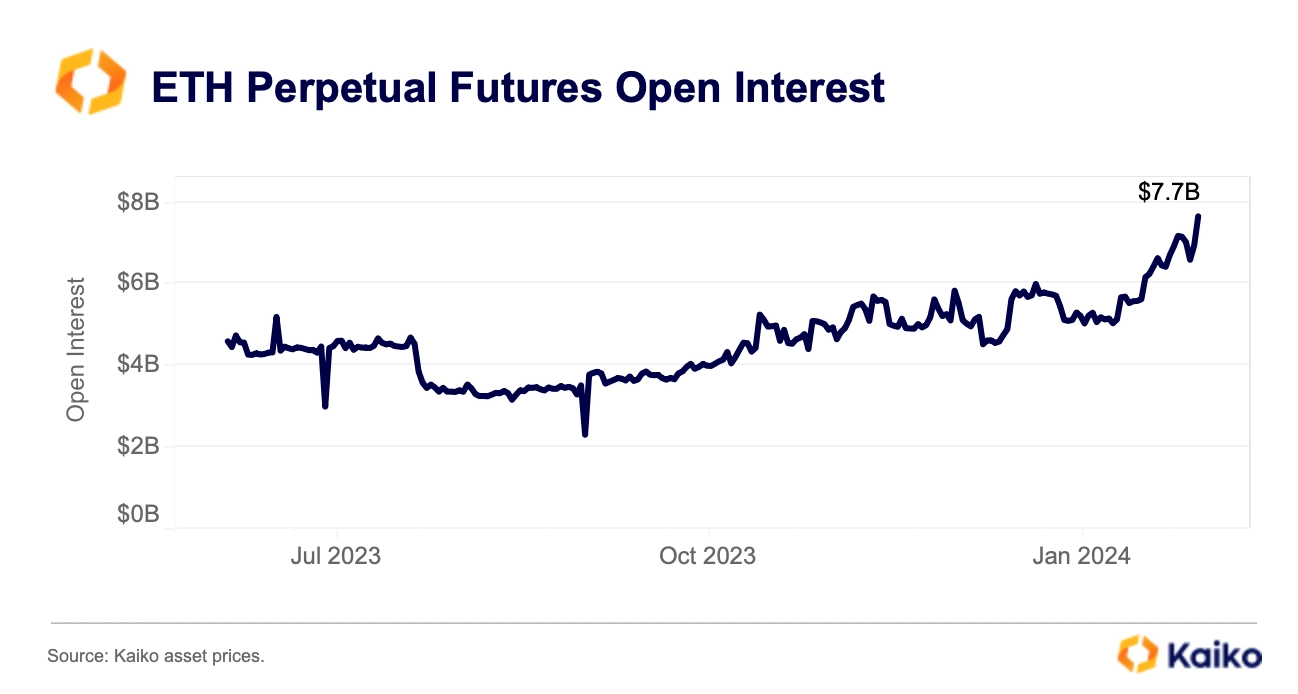
ETH has re-gained momentum since February 12 on hopes that a potential spot ETH ETF approval will boost demand amid shrinking available supply. ETH perpetual futures open interest hit a multi-year high of $7.7bn on February 25, suggesting new capital inflows. The daily ETH spot trade volume has also been robust, surpassing $5bn for the longest period since early 2023. This suggests that the recent rally has support.
TUSD DISCOUNT AGAINST USDT HITS ALL-TIME LOW.
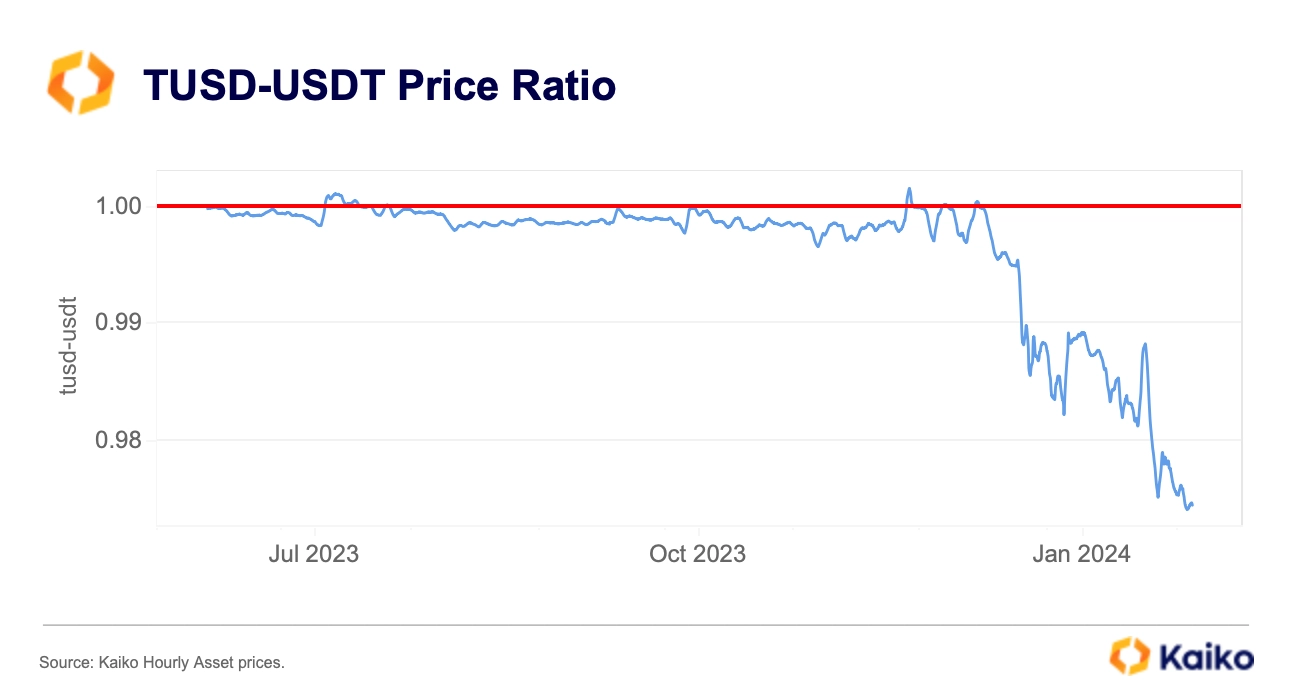
True USD’s TUSD has been trading at a persistent discount against USDT this year, hitting a record low of 0.974 USDT over the weekend. Earlier this year Binance removedTUSD as one of the staked tokens from its Launchpools, causing mass selling of the stablecoin.
However, the selling pressure has intensified in February with a net selling volume of more than USD 16 million for TUSD against USDT on Binance in the last 30 days. Selling also outweighed buying on other exchanges such as Poloniex and HTX, indicating a broadening lack of demand now that the stablecoin has lost its dominant use case.
STRK SEES SLUGGISH VOLUME AFTER CONTROVERSIAL AIRDROP.
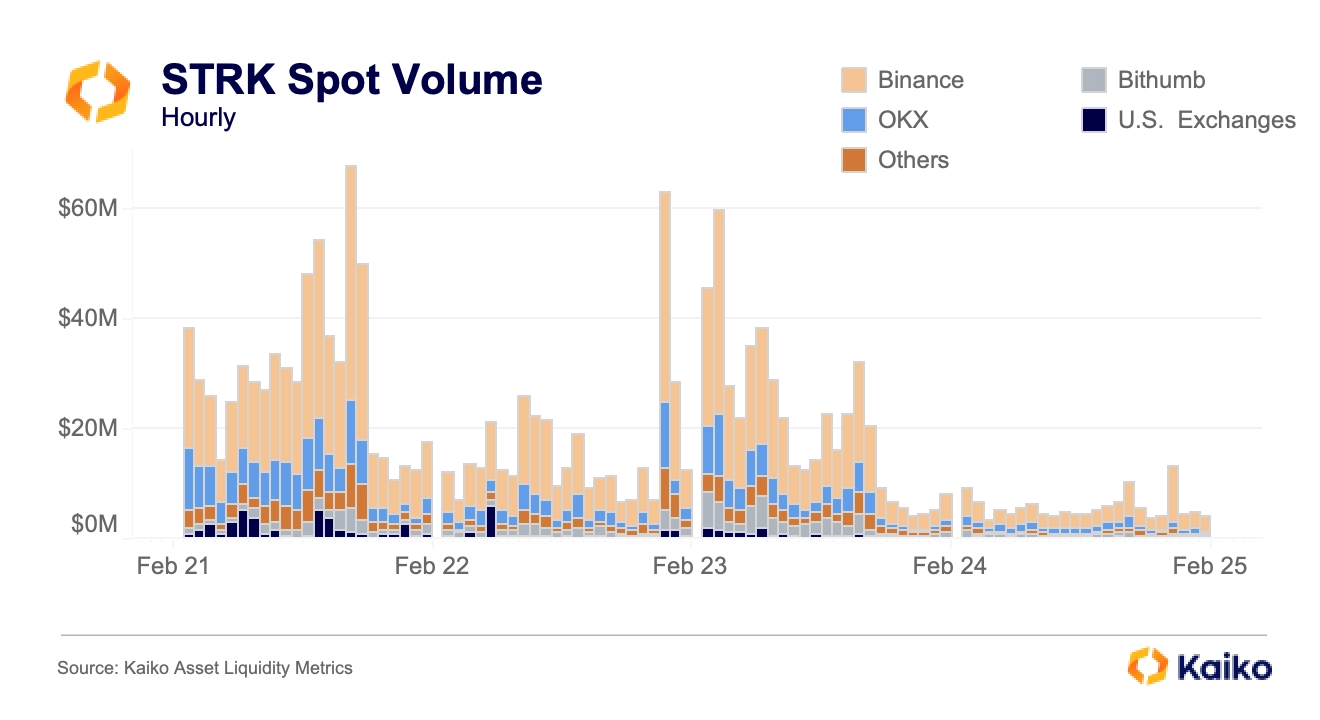
Starknet airdropped its long-awaited STRK token to 1.3 million addresses last week, with a special emphasis on distributing tokens to Ethereum stakers and to developers who had contributed to the network. While the airdrop went smoothly given its size, the airdrop faced criticism regarding its vesting schedule, under which early investors’ and team tokens would unlock in April 2024. The team reversed course following the blowback, creating a more linear unlock schedule.
Despite the hype around the airdrop, volumes were relatively sluggish on centralized exchanges, registering under $750mn in spot volume in the first full day of trading. As usual, Binance led the way, this time trailed by OKX. Bithumb continued its run of success in Korea, registering decent volumes while competitor Upbit has not listed the token. Trading on U.S. exchanges was limited despite listings on Coinbase and Kraken.
Disclaimer
I confirm that I have read and understood the following: The information contained in this article is strictly the opinions of the author(s). This article was authored free from any form of coercion or undue influence. The content represents the author's own views and does not represent the official position or opinions of CrossAngle. This article is intended for informational purposes only and should not be construed as investment advice or solicitation. Unless otherwise specified, all users are solely responsible and liable for their own decisions about investments, investment strategies, or the use of products or services. Investment decisions should be made based on the user’s personal investment objectives, circumstances, and financial situation. Please consult a professional financial advisor for more information and guidance. Past returns or projections do not guarantee future results. This article is provided by CrossAngle’s third-party research partners. CrossAngle does not have any editorial control over this article and does not warrant the accuracy and timeliness of the information contained herein. This article may contain links to third-party websites, over which CrossAngle disclaims any control or responsibility.
Xangle or its affiliated partners own all copyrights of the written or otherwise produced materials and content provided on the platform. Any illegal reproduction of such content, including, but not limited to, unauthorized editing, copying, reprinting, or redistribution will result in immediate legal actions without prior notice.