

Written by The Kaiko Research Team

Trend of the Week
WHAT THE BONK RALLY SAYS ABOUT SOLANA.
Memecoins are nothing new, but a new entrant has taken the crypto industry by storm: BONK. The Solana-based memecoin surged 40% last week after getting listed on Coinbase, and is up a whopping 850% YTD.
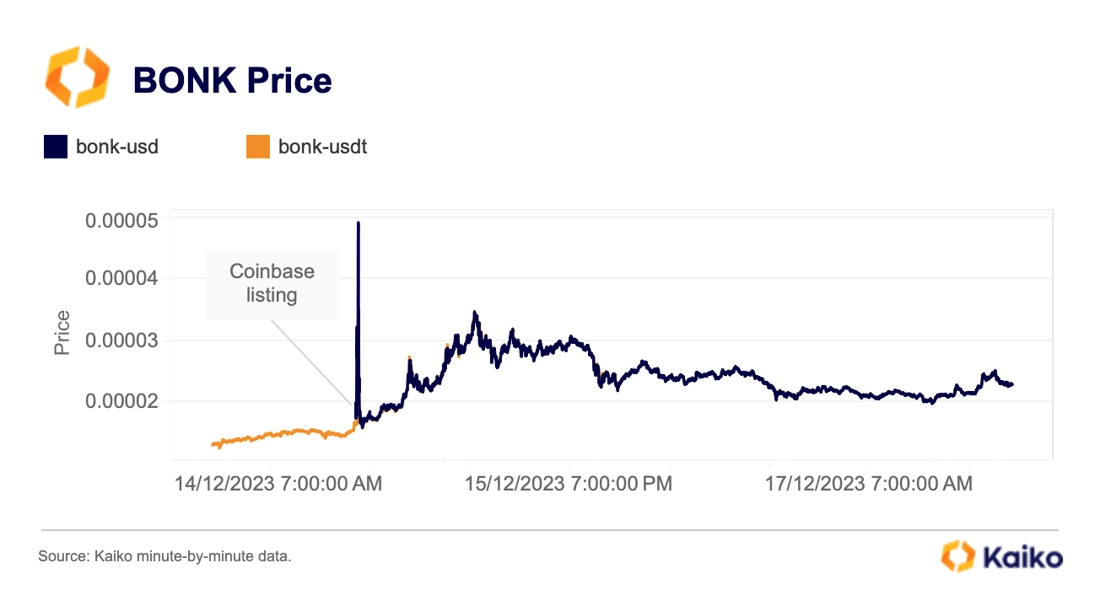
BONK was actually created last year in the aftermath of SBF’s downfall when sentiment around the Solana ecosystem was at all time lows. So what explains the surge? Recently, BONK has gained adoption beyond its meme origins, with several Solana projects integrating the token for payments.
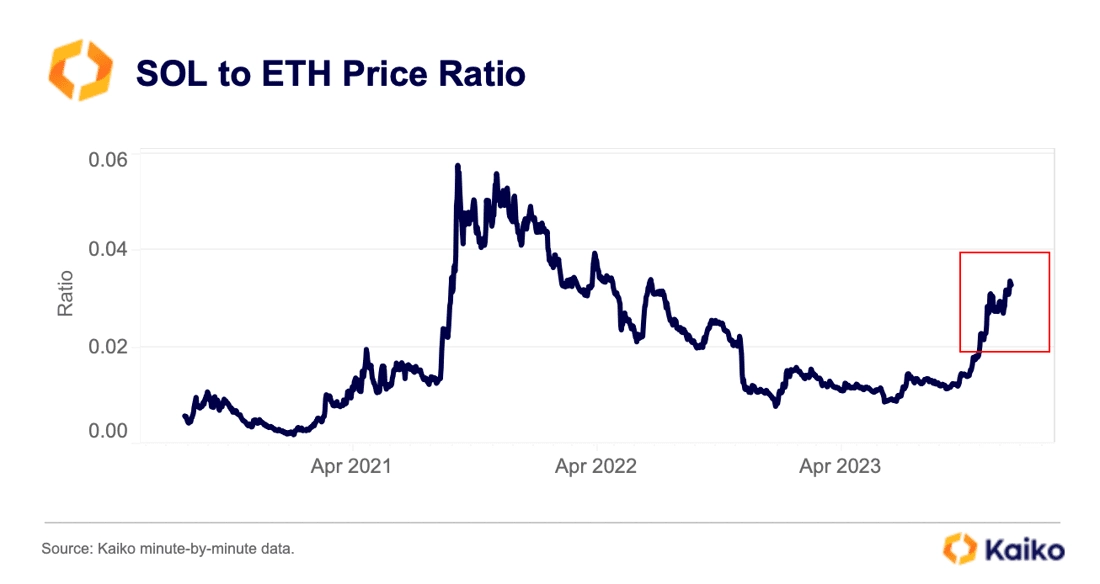
The rally also correlates with renewed enthusiasm around Solana, which has remained resilient despite immense headwinds triggered by FTX’s collapse. SOL is one of the year’s best performers and is far outpacing ETH since early Fall, with the SOL/ETH price ratio reversing for the first time since 2021.
The SOL rally has reportedly upended the FTX bankruptcy claims market. The FTX estate still holds ~$4.2bnSOL, up from just $1.16bn at the start of the year, causing the market for claims to turn “red hot” as the value of FTX’s crypto holdings rise. The BONK rally also caused Solana phones to sell out because they included a 30mn BONK airdrop.
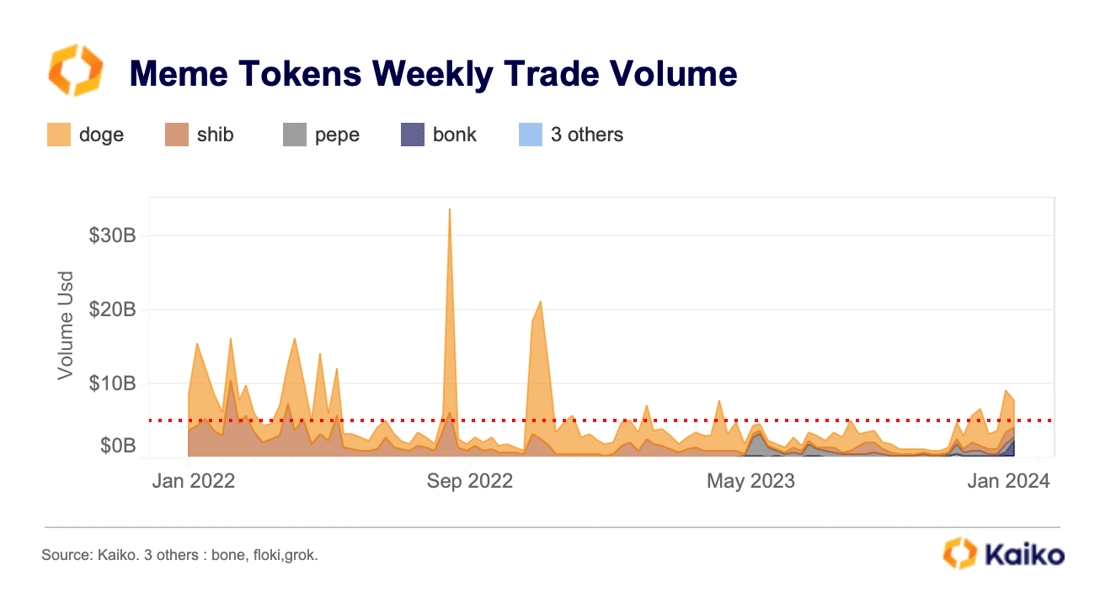
As for memecoins, trade volumes are still well below all time highs but are above the two-year average. Trade volume for the top seven memecoins was just above $9bn last week, up from yearly lows of $1bn.
While BONK’s gains may not last forever, the token’s ascent highlight Solana’s almost miraculous recovery. At the start of 2023, many considered the ecosystem as good as over, but today, DeFi protocols are thriving and developers continue to build.
Will an ETF boost Bitcoin’s liquidity?
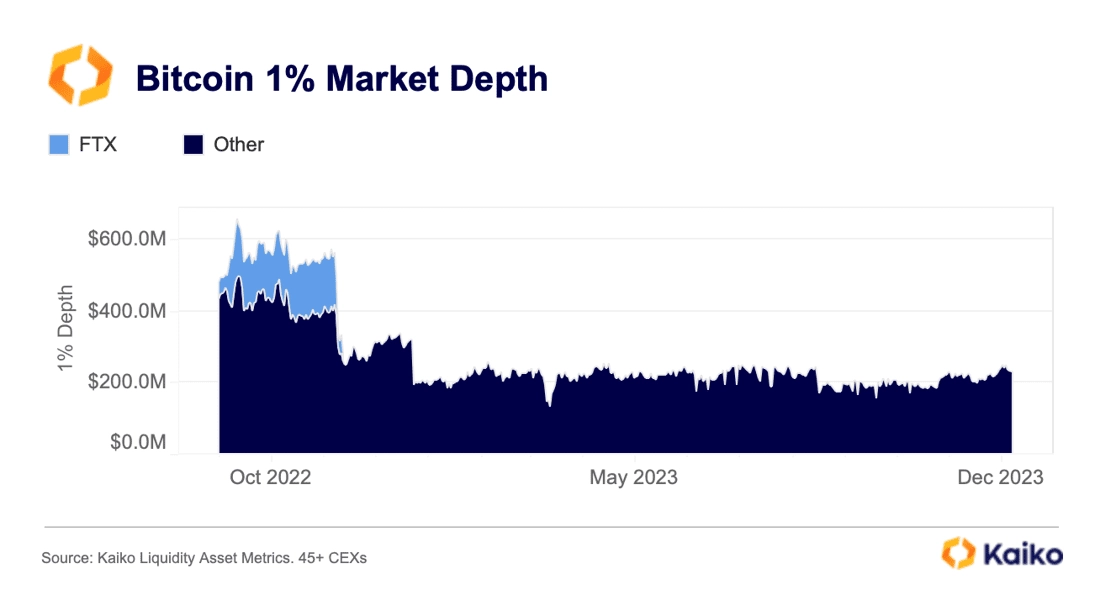
There’s no sugar-coating the facts: both volumes and order book depth have dropped across the board, for all assets, on all exchanges since the FTX collapse. But, with a possible spot ETF approval as soon as January, there is hope that liquidity could soon see a real recovery (despite some risks of a negative impact). In our latest Deep Dive we explore how liquidity could be transferred via trading and market making once an ETF is approved. We also assess the current state of bitcoin’s liquidity.
Bitcoin is poised for a strong year-end.
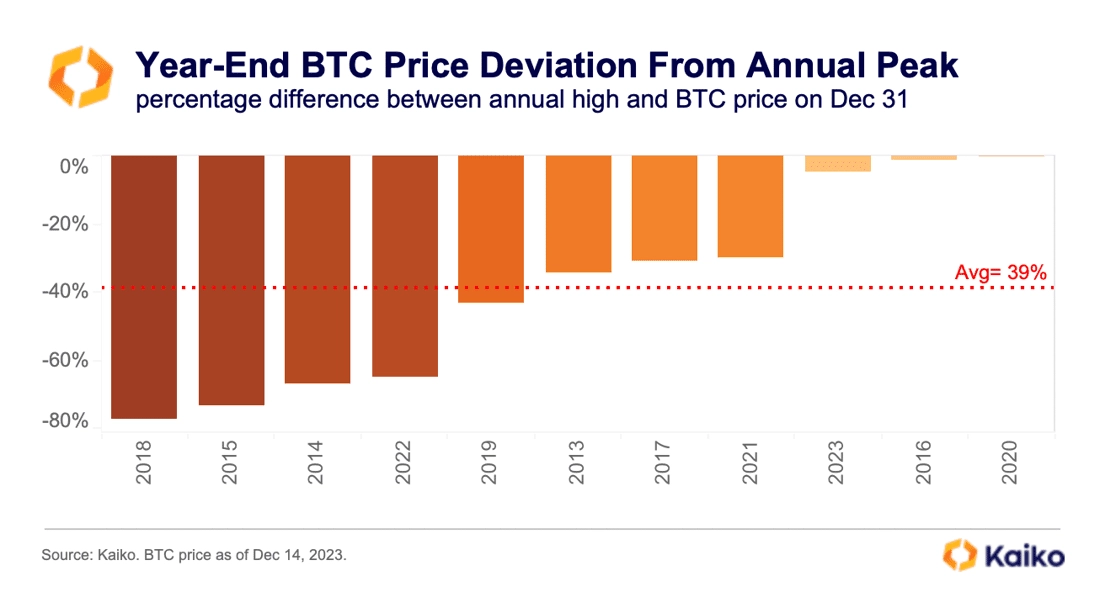 Historically, year ends have not been a great period for crypto markets, with BTC closing the year down 40% on average relative to its annual peak over the past decade. This year, however, BTC is down just 4.8% (so far) relative to its YTD high hit on December 9th, boosted by a cocktail of spot ETF enthusiasm and the U.S. Fed’s monetary pivot. Over the past ten years only two other year-ends have been better: 2016 and 2020.
Volume on Korean exchanges hits YTD high.
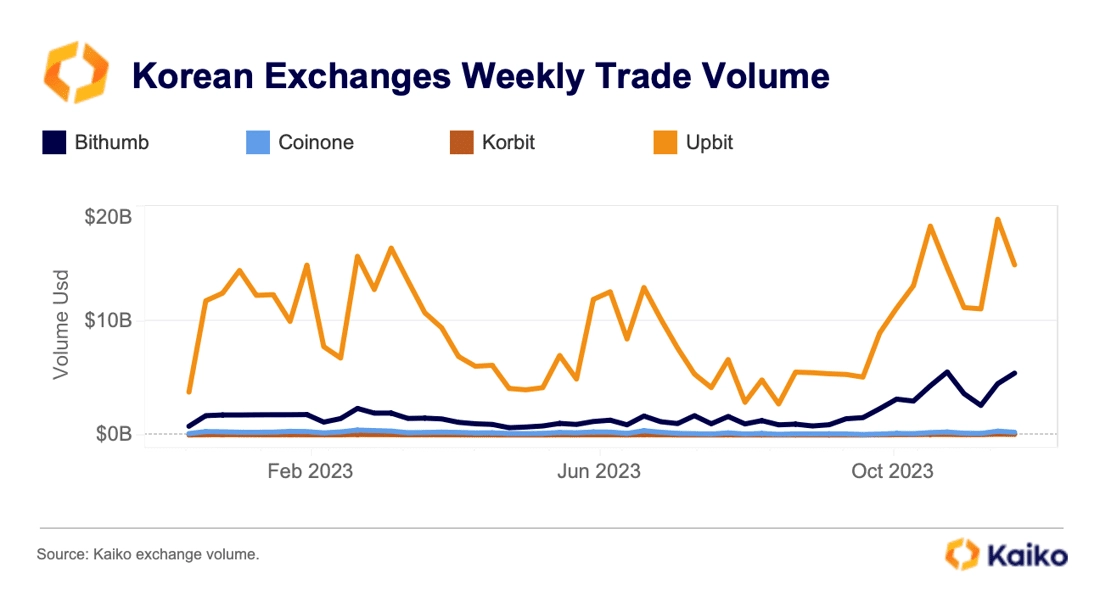
Weekly trade volume on the four big Korean crypto exchanges — Upbit, Coinone, Bithumb and Korbit — hit a yearly high of $24bn in early December. This is an eight-fold surge from September lows. Korean markets are dominated by altcoins, which account for more than 80% of total volume and typically see a greater increase in trading activity in a risk-on market environment. In addition, two Korean exchanges Bithumb and Korbit launched zero-fee promotions over the past few months.
Rising volumes caused crypto volume denominated in the Korean won (KRW) to surpass volume denominated in the dollar for the first time since mid-2021.
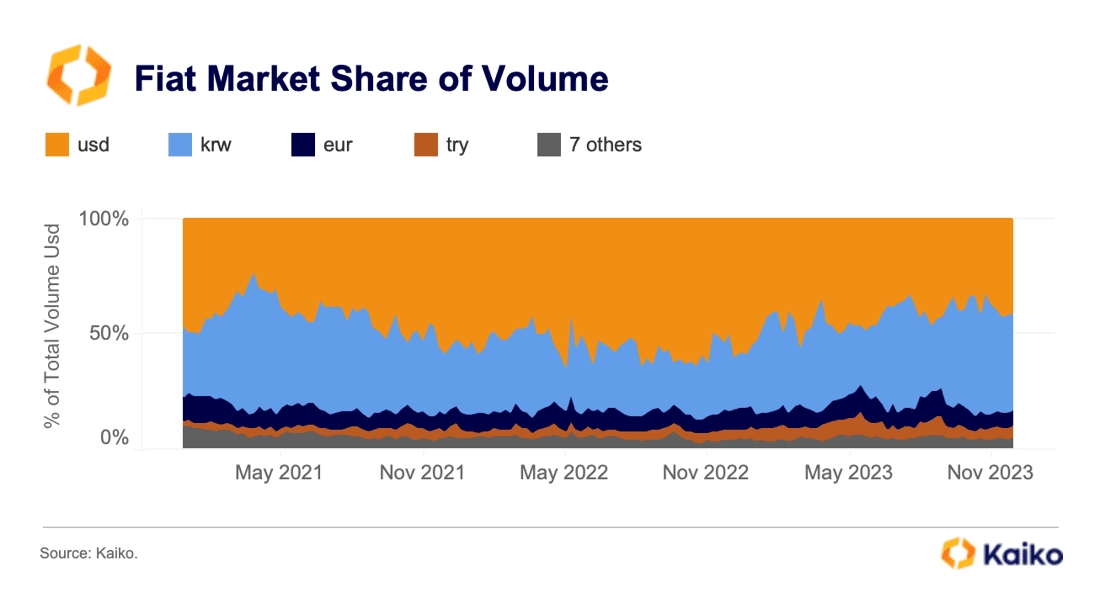 The Won accounts for 42% of fiat volume compared to 41% for the USD, relative to other fiat currencies. The euro remains the third most popular fiat currency with a market share of 6.5%, followed by the Turkish Lira (TRY) with 5.2%.
USDT selling on HTX bottoms at the end of November.
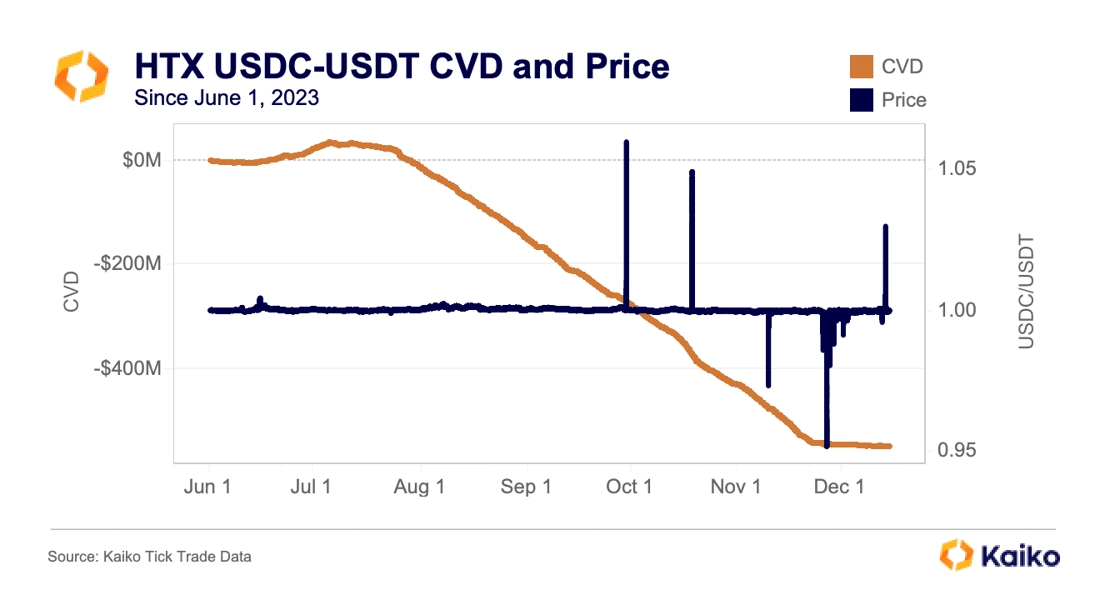
In October we wrote about unusual USDC-USDT activity on HTX (ex. Huobi). Since the start of July more than net $400mn of USDT has been sold for USDC on the exchange, which led to significant USDT depegs on HTX’s USDT-USDC pair. These price discrepancies were confined to the exchange and did not impact other trading pairs.
Interestingly, USDT selling on HTX appears to have bottomed just before Thanksgiving, as measured by CVD (cumulative volume delta). When CVD is negative, this means there are more sellers than buyers, and the flat line shows that the selling has since stopped, which seems to have caused USDC to briefly de-peg to as low as .95USDT.
While not definitively linked, using Kaiko’s new wallet data, we’ve been able to find that two wallets linked to HTX have also transferred similar amounts of USDC to Binance since the start of July.
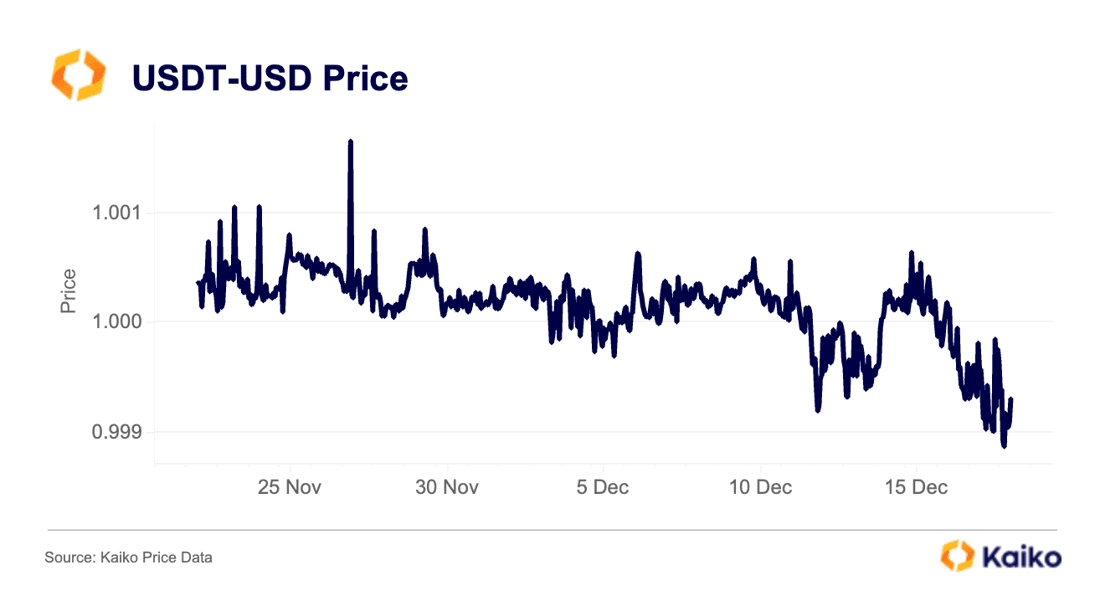 Meanwhile, over the weekend USDT began trading at its widest discount to the dollar since July. The two events are likely unrelated, but they both raise questions about mysterious USDT selling.
The U.S. Fed signals a monetary policy pivot.
Last week, the U.S. Fed signalled the end of its most aggressive monetary policy tightening cycle in four decades, boosting a cross assets rally. BTC gained nearly $1k in the hours following the Fed meeting. The Nasdaq 100 hit a record high for the first time since 2021 while US Treasury yields (which move inversely to prices) plummeted.
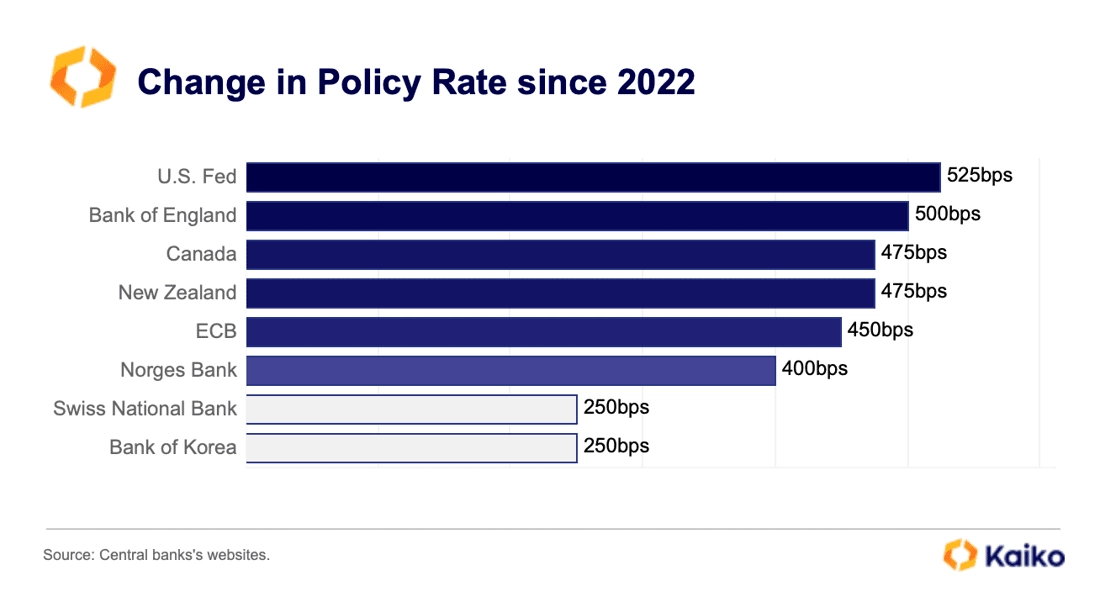
Over the past two years the Fed was the most hawkish central bank among developed countries, with a cumulative increase of 525 bps in rates since the start of 2022, compared to the Bank of England’s 500bps, Canada’s 475bps and the ECB’s 450bps.
Probabilities for a rate cut as soon as March have increased significantly and now hover around 67%, up from 35% a month ago, according to the CME FedWatch tool.
Overall, however, markets remain notably more optimistic than the Fed, with investors currently pricing in six 25bps rate cuts for 2024—double the number indicated by the U.S. central bank.
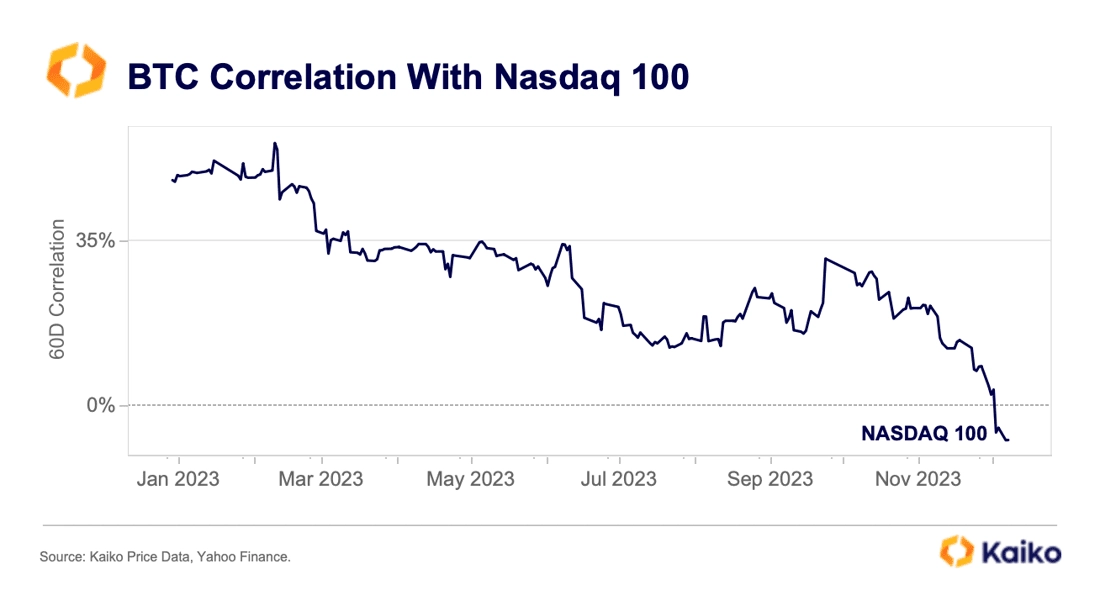
Over the past months, Bitcoin has mostly been driven by crypto-specific factors such as the ETF narrative and the recent Binance deal with U.S. regulators. Its 60-day correlation with the Nasdaq 100 has fallen from an average of more than 60% in 2022, to a negative 7% last week.
However, the end of the most aggressive hiking cycle in years should help broaden the crypto rally attracting new capital into altcoins.