Unlocking Smart Operations:A Guide to Data-Driven Insights for Web3 Game Developers

In the dynamic landscape of the web3 games industry, the downturn presents challenges and opportunities for developers. The ability to leverage data is critical for game developers to survive and thrive.
Data enables developers to monitor in-game economies in real-time and analyze player behavior. This unlocks invaluable intelligence to optimize game design, increase player retention, inform effective monetization strategies, and cultivate thriving in-game communities.
A Turn Key Solution to Web3 Project Analytics
Footprint Growth Analytics (FGA) is a web3 project product intelligence and analysis platform. It provides an integrated solution for web2 and web3 data ingestion, processing, and visualization.

There are several features of FGA:
- On-off chain data integration & web3 data abstraction
The platform boasts several key features, such as on-off chain data integration and web3 data abstraction, enabling a comprehensive understanding of the project’s data landscape.
- On-off chain funnel analysis
FGA’s prowess extends to on-off chain funnel analysis, allowing in-depth insights into user interaction.
- Wallet profiles to check project audience and find target users
Additionally, the platform provides wallet profiles, empowering users to scrutinize project audiences and precisely identify target users.
By consolidating data in one central hub, FGA is a valuable tool for operations, developers, and marketing teams, streamlining workflows, saving time, and enabling a more focused approach to acquisition, strategy, and development efforts.
Types of data you should monitor
Our intuitive and user-friendly interface is meticulously crafted to ensure a seamless experience. Navigate effortlessly through various tabs to access vital information that fuels your game operation journey.
From integrating user data, tracking events, and monitoring Twitter and Discord interactions to managing project information, FGA Metrics empowers you with the tools to refine your game development strategy. Explore the flexibility of adding multiple projects, enhancing your ability to tailor analytics to the unique needs of each endeavor.
If you are a venture capitalist or involved in developing multiple games, FGA facilitates an aggregated view where you can effortlessly track and monitor all your games. This centralized perspective streamlines the oversight of various projects, providing a convenient and efficient way to stay informed about each game’s performance and analytics.
Let’s take a closer look at the key metrics.
Assets performance
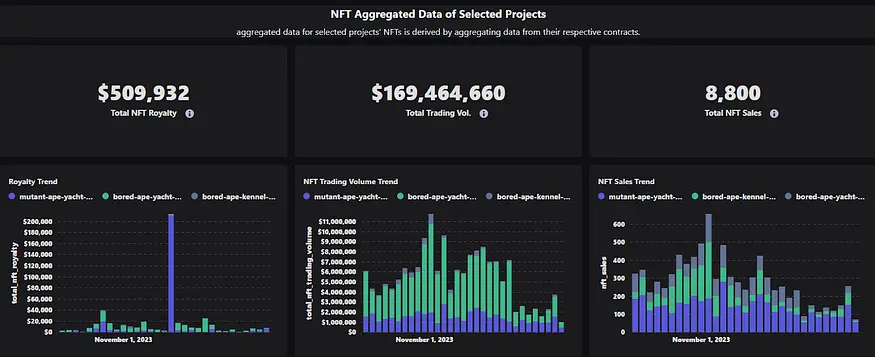
Asset performance is critical to the web3 game, focusing on tokens and NFTs.
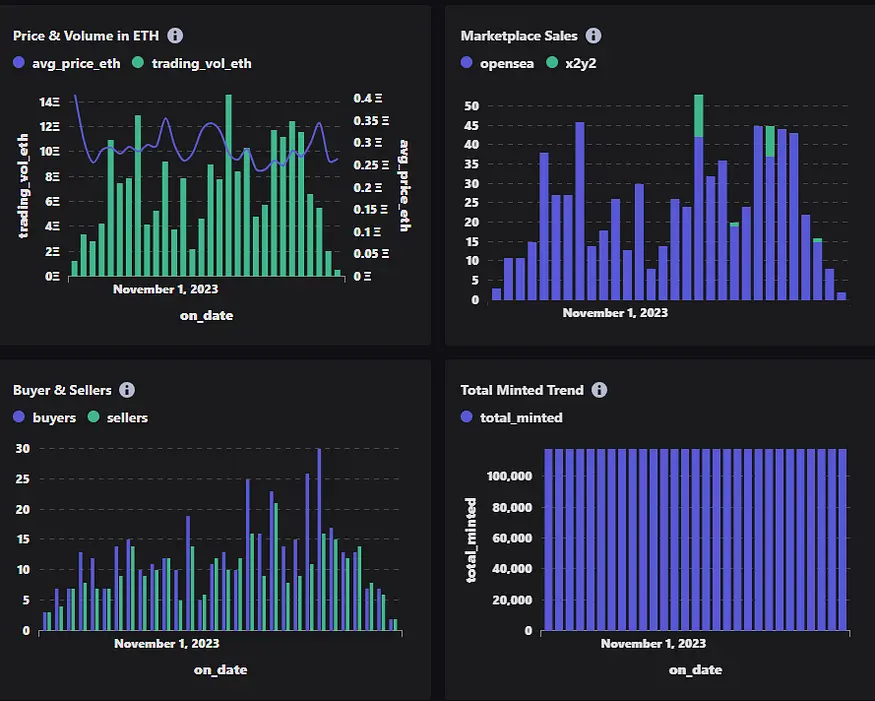
In NFT, developers get detailed summaries, sales and minting data, listings, and holder information for NFTs. The NFT Leaderboards provide the top winners and losers of that NFT, making it easy to find smart money. The Token tab provides various metrics for the game’s token, with the flexibility to toggle between contract addresses, enabling developers to make data-driven decisions about token dynamics, circulation, and market sentiment.
Understanding asset performance benefits web3 game development by enabling optimization of in-game economies, responding to market trends, and enhancing player experiences.
Revenue
Revenue is a key aspect of the development process, facilitating the integration of off-chain data through connectors added to the FGA. This feature provides a comprehensive view of the game’s financial performance by categorizing revenue into three key components: total revenue, individual web3 revenue, and web2 revenue.
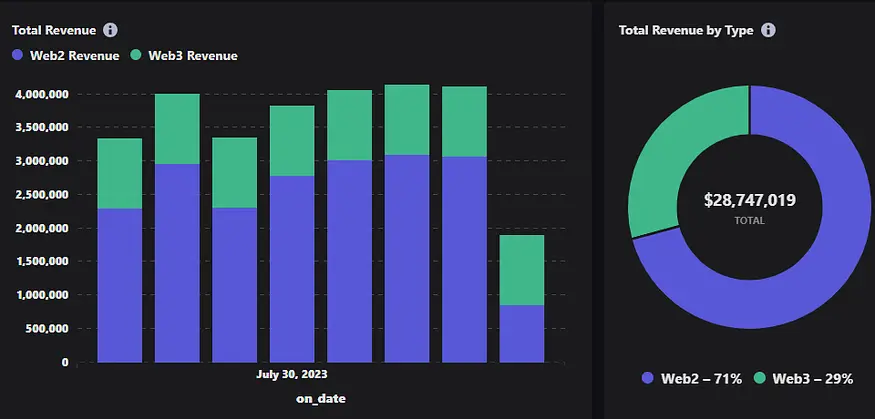
Integration of off-chain data through connectors increases the accuracy and depth of revenue insights, enabling developers to make informed decisions about their monetization strategies. This holistic view of revenue streams is instrumental in adapting and refining the game’s financial model to ensure sustainable growth and success in the ever-evolving web3 gaming landscape.
Wallet Data
Footprint also provides wallet-related data, giving developers a comprehensive view of key metrics related to user acquisition, engagement, retention, and community interactions.
- Acquisition: Metrics include total new users, total new users with wallets, and more, providing insight into the growth of the wallet-connected user base. divided into users with connected wallets and those without.
- Engagement: Daily and monthly active wallet counts and trends are available. Dive into users, metrics such as average play time, sessions played, rewards, win counts, and ratios provide a detailed understanding of player engagement to better inform game design.
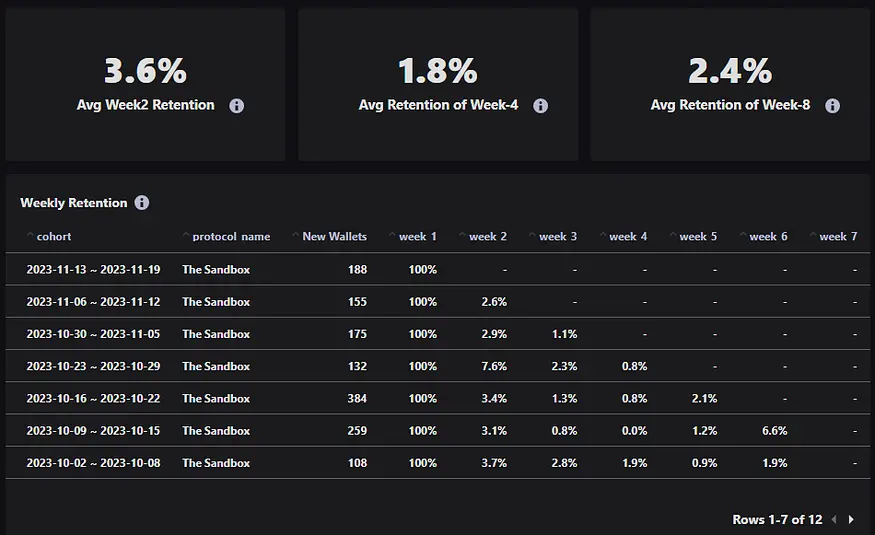
- Retention: The Retention section gives developers insight into user and wallet retention rates over time, including weekly and daily retention metrics. This information helps developers track and analyze the frequency with which users and wallets remain active, providing a clear understanding of the game’s ability to maintain engagement regularly.
- Community: Footprint also provides Twitter and Discord metrics via connectors. This includes key community engagement indicators such as follower counts, engagement rates, and other relevant metrics to help developers measure the impact of their game on social platforms.
With this wealth of data, developers can make informed, data-driven decisions, ultimately fostering a loyal player base and ensuring the success and sustainability of their web3 games in a dynamic and competitive market.
Exploration More About Your Users
In the Exploration section, developers can dive deeper into user behavior and tailor experiences for optimal engagement.
By accessing wallet profiles, developers can gain detailed insights into individual members, providing a nuanced understanding of user preferences and behaviors.
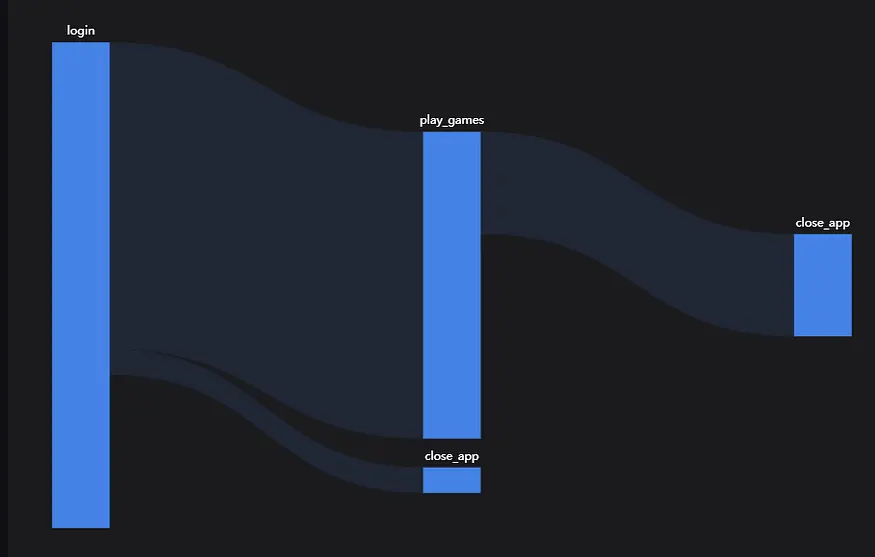
The ability to save user segments enables targeted strategies to ensure that content, rewards, and interactions resonate with specific user groups. The ability to create and view user journeys is particularly valuable, providing a visual representation of each step users take within the game. This allows developers to identify pain points, optimize paths, and improve the overall user experience, enabling developers to create personalized and data-driven experiences that foster stronger connections with users and ultimately contribute to the success of their web3 games.
Disclaimer
I confirm that I have read and understood the following: The information contained in this article is strictly the opinions of the author(s). This article was authored free from any form of coercion or undue influence. The content represents the author's own views and does not represent the official position or opinions of CrossAngle. This article is intended for informational purposes only and should not be construed as investment advice or solicitation. Unless otherwise specified, all users are solely responsible and liable for their own decisions about investments, investment strategies, or the use of products or services. Investment decisions should be made based on the user’s personal investment objectives, circumstances, and financial situation. Please consult a professional financial advisor for more information and guidance. Past returns or projections do not guarantee future results. This article is provided by CrossAngle’s third-party research partners. CrossAngle does not have any editorial control over this article and does not warrant the accuracy and timeliness of the information contained herein. This article may contain links to third-party websites, over which CrossAngle disclaims any control or responsibility.
Xangle or its affiliated partners own all copyrights of the written or otherwise produced materials and content provided on the platform. Any illegal reproduction of such content, including, but not limited to, unauthorized editing, copying, reprinting, or redistribution will result in immediate legal actions without prior notice.