Bitcoin Halving 2024: Will the Market Bull or Bear?
This article features Macroeconomics overview provided by Merkle Capital along with Technical Analysis and Asset Allocation aspect from Cryptomind Advisory
Key Takeaways
-
Bitcoin Halving is set to occur in April 2024.
-
Based on historical statistics, the price of Bitcoin tends to drastically increase after the Bitcoin Halving event.
-
Other factors apart from Bitcoin Halving which contributed to the increase in Bitcoin’s price include the improvement of macroeconomics condition, innovation in Crypto space, and greater acceptance of cryptocurrency worldwide.
-
The BlackRock’s Bitcoin ETF is expected to be a significant catalyst that will garner increased interest in Bitcoin.
-
The Fed may raise interest rates only once more in 2023 and could consider easing them in 2024.
-
The real inflation rate is clearly reversing back down, heading towards pre-pandemic levels.
-
The labor market is gradually stabilizing towards a pre-crisis equilibrium.
-
There is a decline in household income growth, contributing to reduced inflationary growth.
-
The 4-year Cycle theory may come true again due to significant catalysts like the BlackRock Bitcoin ETF and the high likelihood of Fed easing in 2024.
The volatile-asset markets continue to face sustained pressure due to the overall uncertain economic conditions, especially on the U.S. front, which will impact the monetary policy decisions of the Federal Reserve. This will have significant implications for global risk asset markets, particularly the cryptocurrency sector.
Nevertheless, even though the situation remains uncertain and challenging, the year 2024, which is approaching, will witness a significant event in the world of cryptocurrencies: the “Bitcoin Halving.” This event is unique to Bitcoin and will inevitably cut the rate at which new Bitcoins are created in half.
Based on historical statistics, Bitcoin has undergone Halving events three times in the past, often followed by a substantial price surge. Therefore, the question arises: Will there be a similar price increase after the Bitcoin Halving scheduled for April 2024? It's worth noting that previous Halving events and price surges occurred during periods of relatively low inflation and significantly low interest rates. However, this time, it will take place during a period with the highest interest rates in 22 years and the highest inflation in 40 years.
In this article, we will delve into data exclusively from the Bitcoin perspective and analyze alongside predictions regarding the macroeconomic situation in the coming year. This will shed light on the extent of synergy or conflict between these factors, which will serve as a significant indicator of fate for the cryptocurrency market.
1.What is Bitcoin Halving?
In the Bitcoin blockchain system, a consensus mechanism known as Proof-of-Work is utilized for processing various transactions across the globe. This system maintains a single, immutable ledger without the need for mutual trust, thereby safeguarding against double spending within a decentralized network.
The Proof-of-Work computation involves competing computers solving mathematical equations in exchange for the right to validate transactions and append a new set of data to the blockchain. This process is commonly referred to as “Bitcoin mining”, a term familiar to many.

Image courtesy of Cointelegraph
When a miner successfully solves the equation first, not only do they become the data recorder, but they also receive a reward, known as the “Block Reward.” This reward consists of newly minted Bitcoins (block subsidy) as well as transaction or mining fees.
Satoshi Nakamoto, the creator of Bitcoin, embedded a set of commands in the Bitcoin software, initially setting the block subsidy that miners receive at 50 BTC per block. He also introduced what's known as “Bitcoin Halving,” which reduces the block subsidy by “half” every 210,000 blocks. Each block takes approximately 10 minutes to confirm transactions. This is why Bitcoin Halving occurs roughly every 4 years.
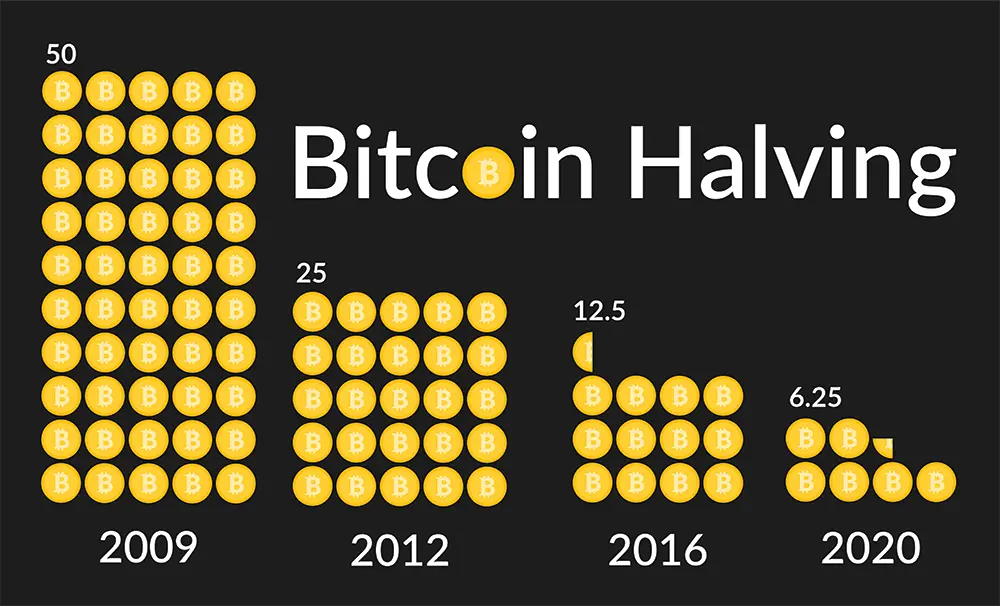
Image courtesy of CoinCodex
Since the emergence of Bitcoin, there have been a total of 3 Bitcoin Halving events:
-
1st Halving: Occurred on November 28, 2012, reducing the block subsidy from 50 BTC to 25 BTC.
-
2nd Halving: Occurred on July 9, 2016, reducing the block subsidy from 25 BTC to 12.5 BTC.
-
3rd Halving: Occurred on May 28, 2020, reducing the block subsidy from 12.5 BTC to 6.25 BTC.
In mid-April 2024, which is approaching, the 4th Bitcoin Halving event will take place, further reducing the block subsidy from 6.25 BTC to 3.125 BTC.
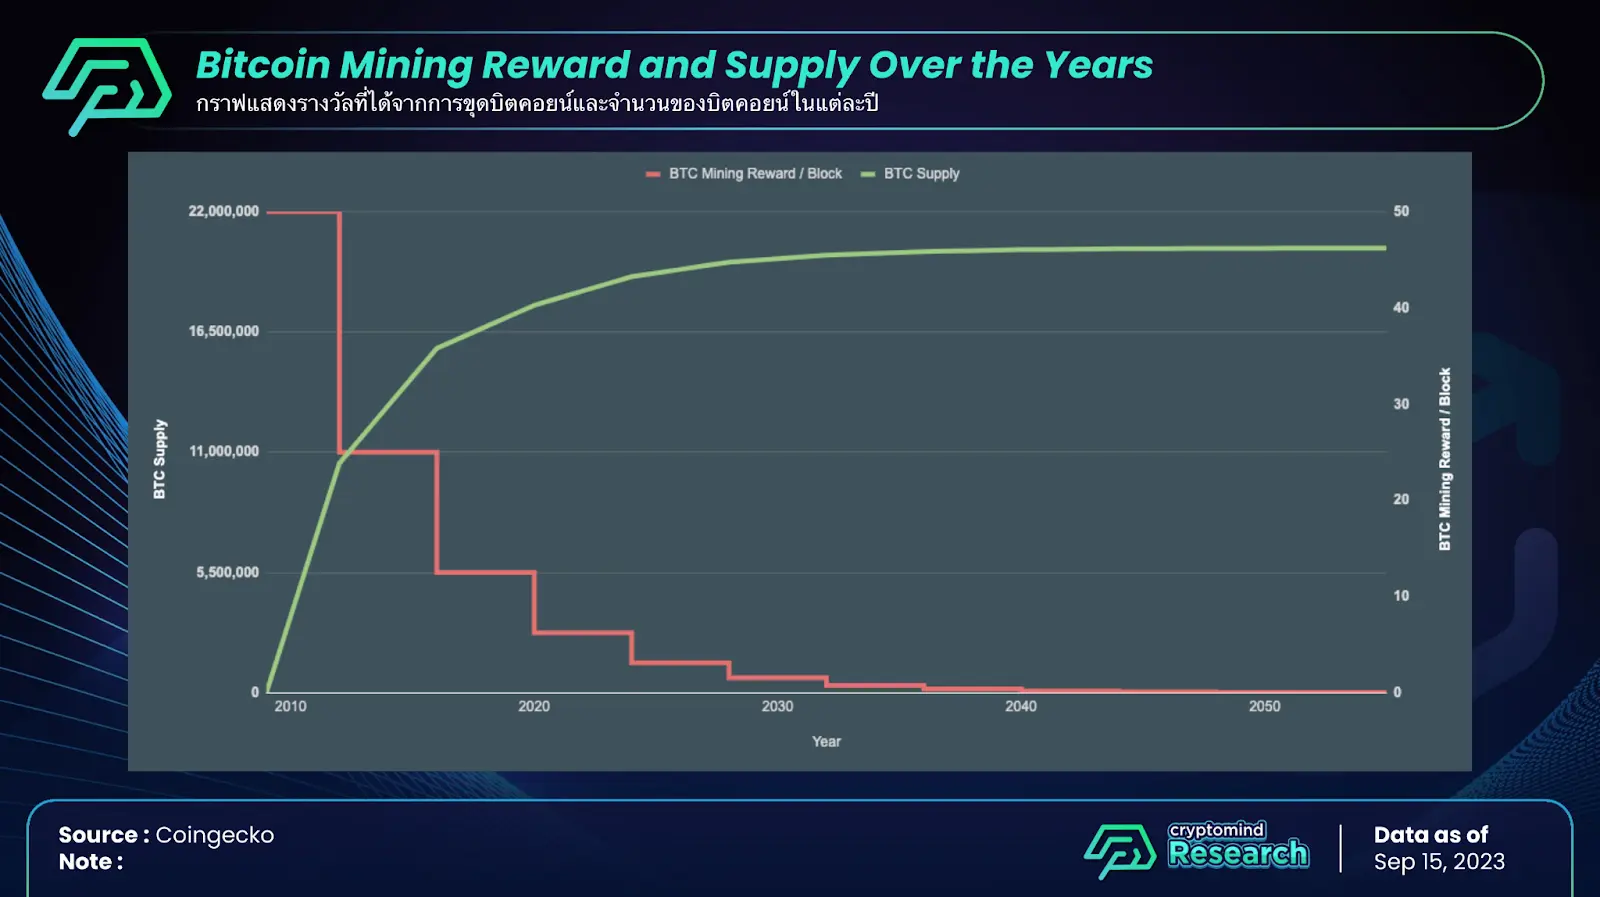
If all the above numbers are calculated and plotted, creating a graph of Block Subsidy (red line) and Bitcoin (BTC Supply) over time (years), you will observe that in the early stages, the rate of Bitcoin production is significantly high, but gradually decreases with each Bitcoin Halving event.
Continuing this calculation until Bitcoin production is no longer possible, we arrive at the figure of the maximum number of Bitcoins that can ever be created in the system: 21,000,000 BTC. These will be mined entirely by the year 2140, approximately 117 years from now. As of the time of writing, the number of Bitcoins that have been mined stands at over 19,466,643 BTC, which is roughly 92.7% of the total.
2.Bitcoin Halving Historical Statistics
For those wondering why Bitcoin Halving garners so much attention, it's because if you look back at the relationship between Bitcoin's price adjustments and Bitcoin Halving events, you'll see a clear and compelling correlation.
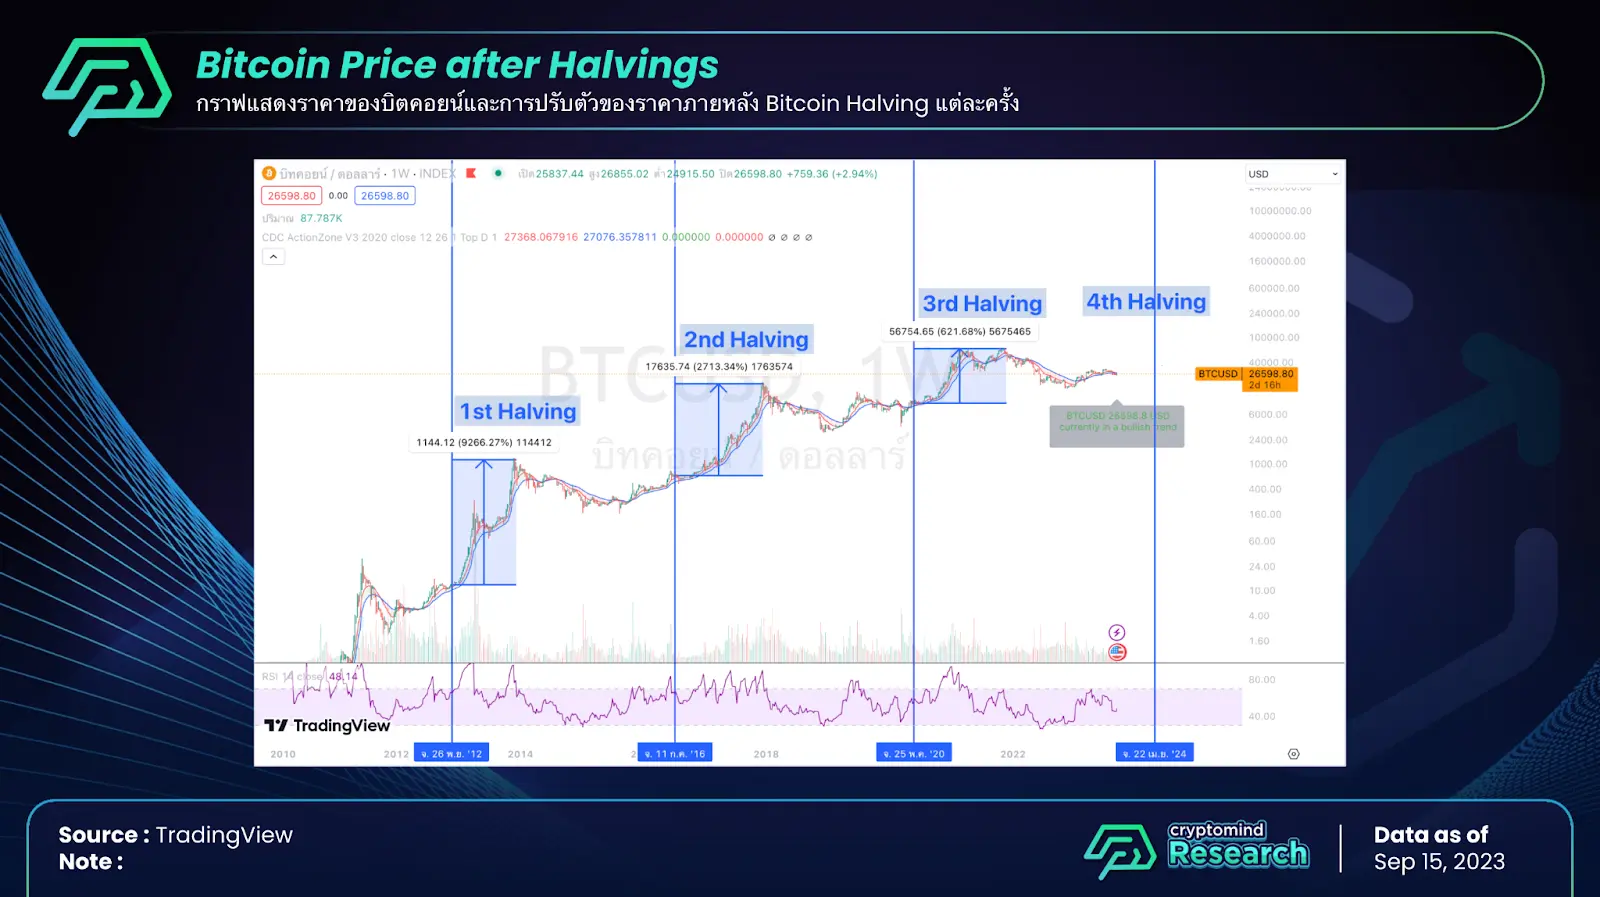
The graph above illustrates the post-Bitcoin Halving price behavior for all three occurrences. Following each Bitcoin Halving event, there has consistently been a significant and vigorous price surge. The price adjustments, measured from the day of the Bitcoin Halving, are as follows:
-
1st Bitcoin Halving: The price increased by approximately 9,200%, equivalent to 92 times.
-
2nd Bitcoin Halving: The price increased by approximately 2,600%, equivalent to 26 times.
-
3rd Bitcoin Halving: The price increased by approximately 600%, equivalent to 6 times.
However, if you calculate from the lowest point of each cycle, which typically occurs before Bitcoin Halving, the results are even more astonishing. This is the reason why Bitcoin Halving has become a highly anticipated and significant event that captures the attention of many.
Nonetheless, it's essential to note that the statistics provided above are based on just three occurrences, which is relatively limited in statistical terms. Therefore, it's possible that future Bitcoin Halving events may result in different outcomes, whether positive or negative.
2.1 Price Adjustments in Bitcoin Compared to Various Key Events in the Crypto World
When considering other factors, it's important to acknowledge that these events may also be coincidental because each Halving event occurs approximately every 4 years, which coincidentally aligns with new and noteworthy developments in the crypto world or even align with changes in financial/economic policies. These factors could play a part in the resurgence of the crypto market.
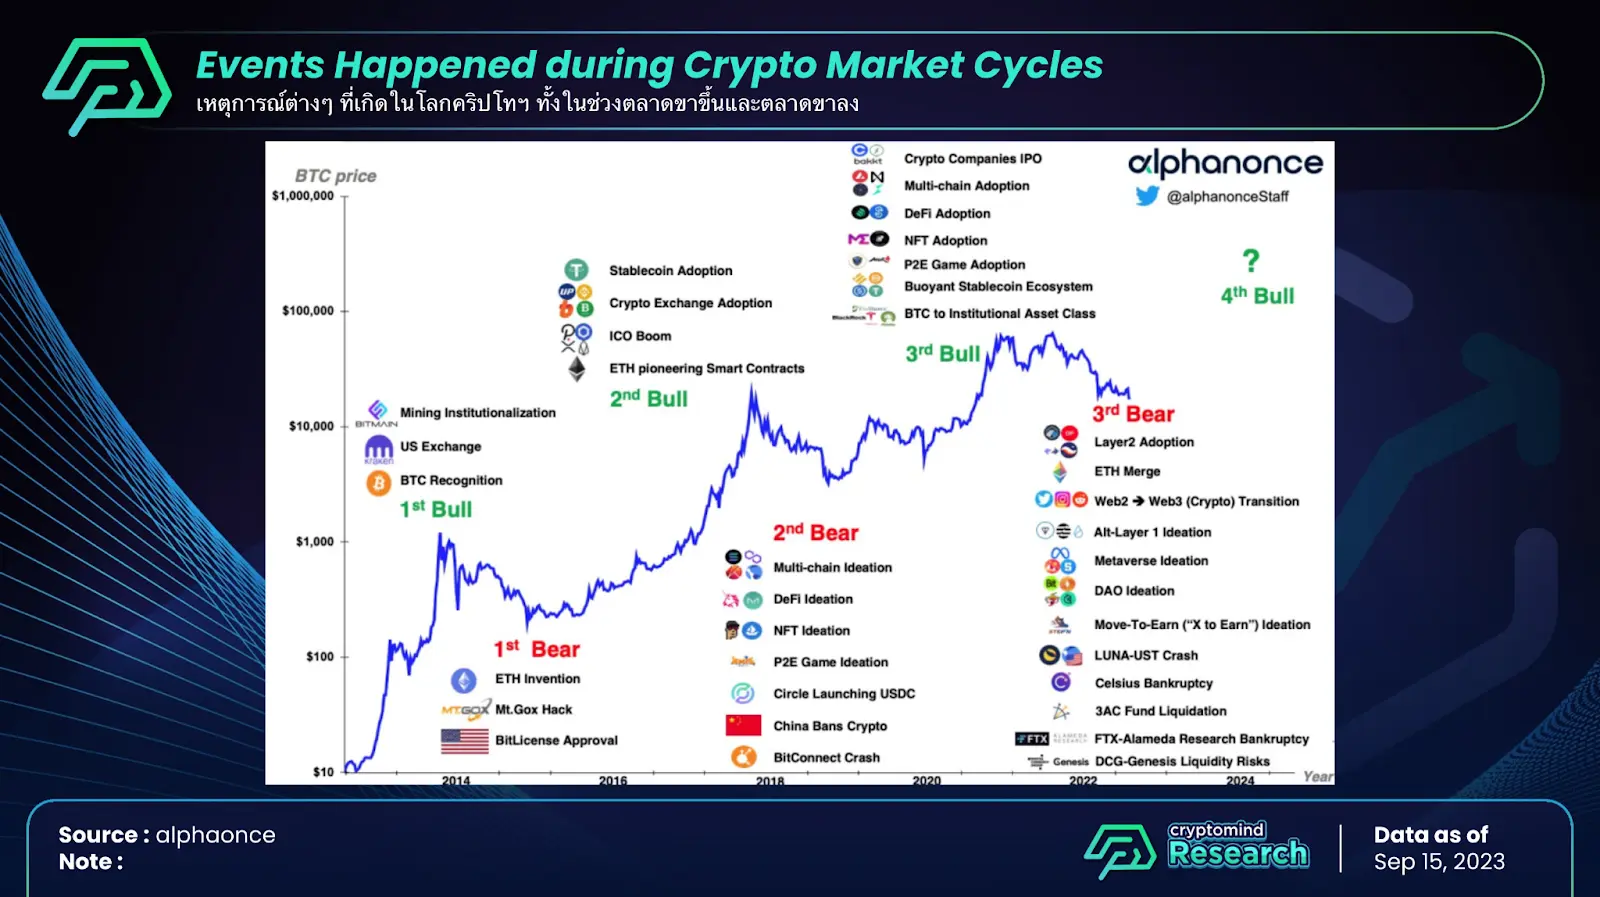
From the chart above, we can see various events that have occurred during each Bitcoin Halving cycle. These events are the primary reasons that pique people's interest in the crypto market during each cycle, starting with
1st Halving, or the 1st Bull Run: Bitcoin gained more widespread recognition as businesses related to Bitcoin began to emerge. Exchanges were established, and other cryptocurrencies claiming to be faster and better than Bitcoin, such as Litecoin and XRP, came into existence.
2nd Halving, or the 2nd Bull Run: Ethereum's smart contracts gained recognition, and tokens were created on the Ethereum network. Stablecoins also gained popularity, and various projects raised funds through Initial Coin Offerings (ICOs), leading to the ICO Boom.
3rd Halving, or the 3rd Bull Run: Registered companies in the United States, like Tesla ($TSLA) and Microstrategy ($MSTR), announced their holdings of Bitcoin in their balance sheets. Additionally, numerous interesting applications emerged on Layer 1 blockchains, including Decentralized Finance (DeFi), GameFi, and NFTs. During the COVID pandemic, there was extensive Quantitative Easing (QE), a massive injection of money into the financial system, which led to a stock market rally as well as the crypto industry.
2.2 Price Adjustment of Bitcoin in Comparison to the Global Increase in Money Supply
Another intriguing perspective is the price adjustment during the post-Halving period, which appears to align with the increase in the global money supply (Global M2). This consideration stems from the growth of M2 in major central banks, including the United States (Fed), Europe (ECB), China (PBoC), and Japan (BOJ).
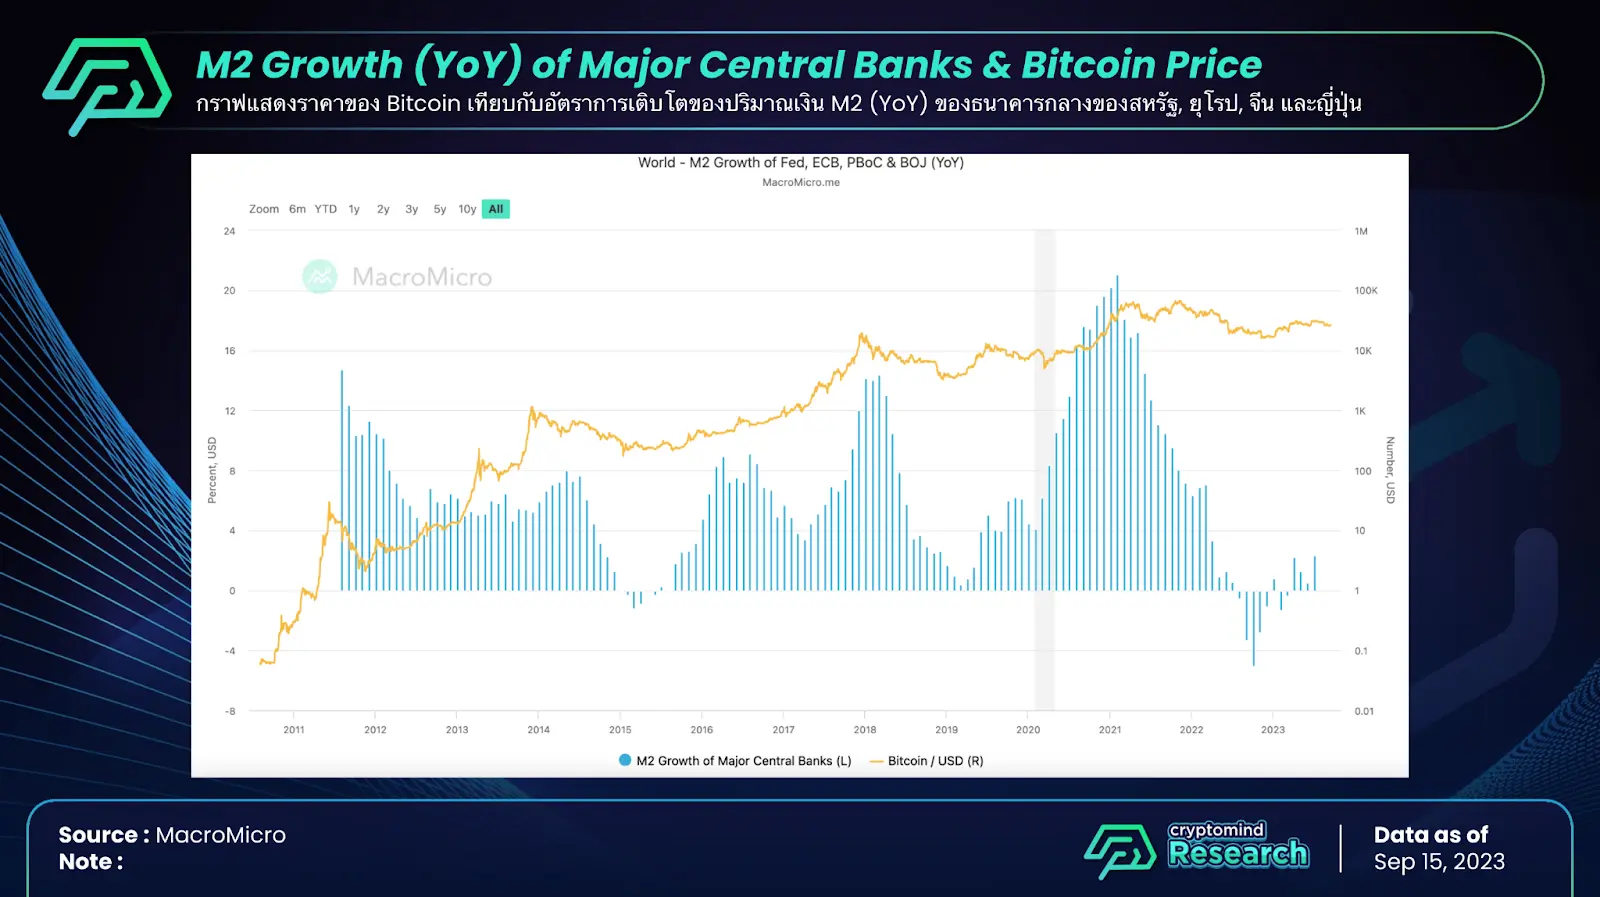
M2 consists of the money supply in the system, comprising M1 (banknotes, coins, and current deposits) and the savings and fixed deposits of the public. When considering M2 from the four major central banks mentioned earlier in relation to the price of Bitcoin, it becomes evident that the period when Bitcoin adjusts upwards aligns with a significant increase in Global M2 (YoY). This could potentially be a coincidental correlation with the approximately 4-year timeframe of Bitcoin Halving.
If the price of Bitcoin is indeed correlated with the increase in money supply, then what we need to keep an eye on for the next Bull Run is the monetary policies of major central banks, especially the Federal Reserve. We will delve into this topic further in the following sections of this article.
However, it's important to note that the occurrence of Halving doesn't mean it has no impact on the price. Halving reduces the production rate, making Bitcoin scarcer. If there's an increasing demand for Bitcoin, it can drive purchasing power, especially when the supply remains relatively stable. At this point, over 92.7% of Bitcoin has already been mined, and it can potentially lead to a price surge. Demand may come in the form of profit-seeking from the injected money supply mentioned earlier.
3. Factors that contribute to the 4-Year Cycle
As mentioned above, potential factors that can drive Bitcoin's price increase besides Bitcoin Halving can be
-
New developments in the cryptocurrency world that can draw people's interest once again, including increased adoption.
-
Economic situations, especially the monetary policies of the Fed."
In the following sections, we will explore what we believe will stimulate people's return to Bitcoin and cryptocurrencies, as well as predictions for the economic situation in 2024 and whether it will contribute to this trend.
3.1 BlackRock Files Application for Bitcoin ETF
For Bitcoin, there are many new and interesting developments in the world of Bitcoin, but for those who are not familiar with Bitcoin, it may still be difficult to understand things like Lightning Network, Nostr, and more. However, there is one thing that people in the investment world are familiar with, and that is the Exchange Traded Fund (ETF).
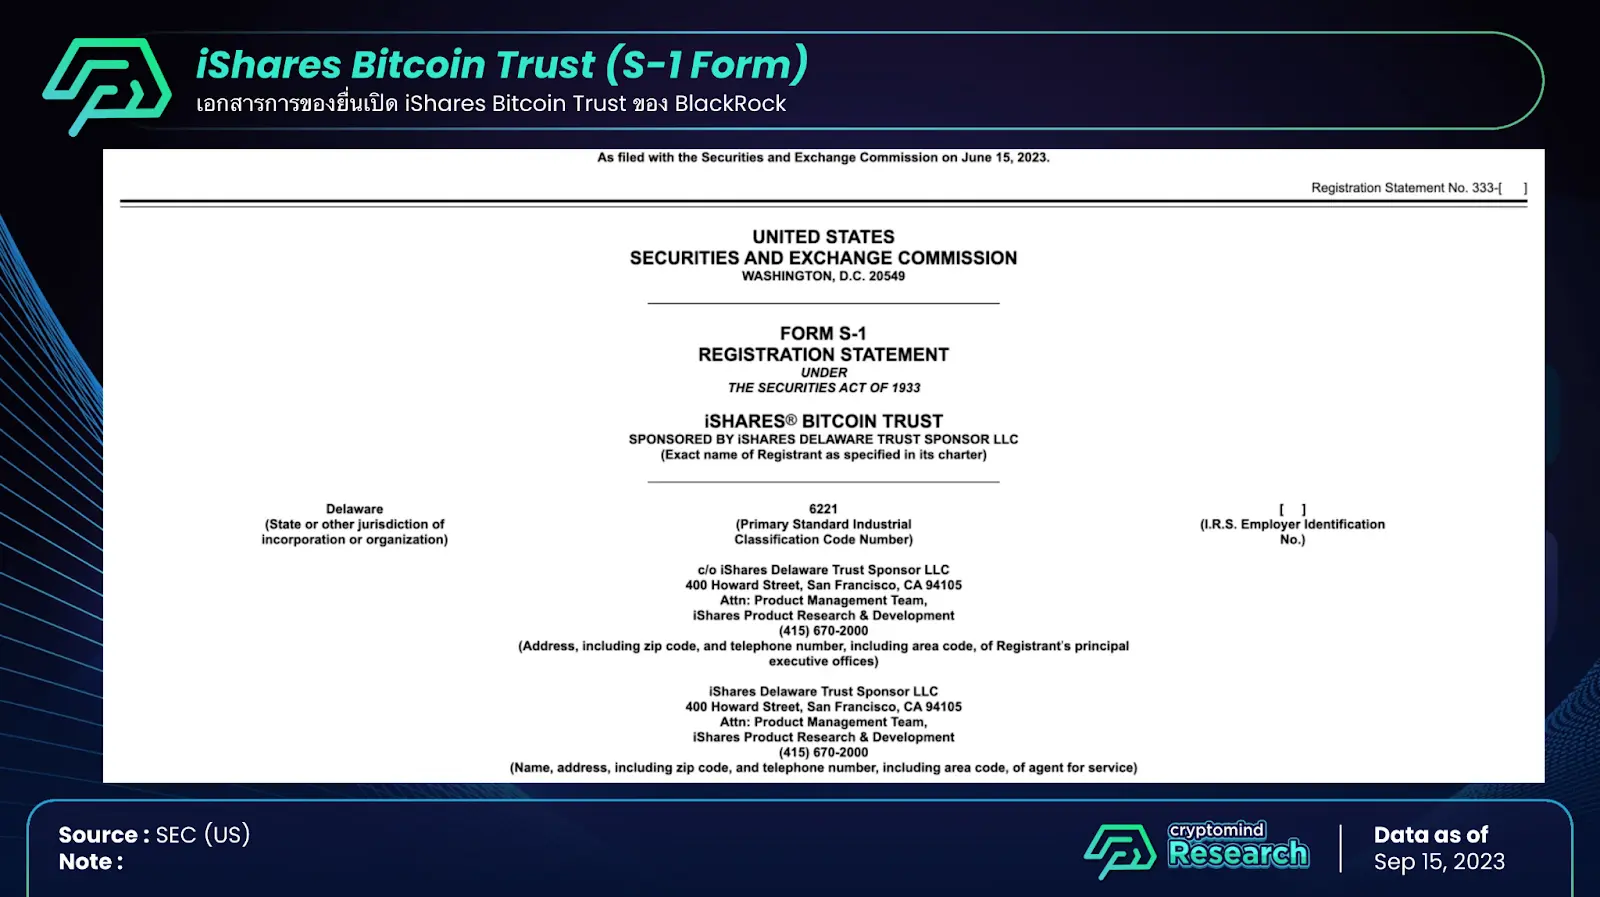
On June 15, 2023, BlackRock, the largest investment management company in the world, filed for a Bitcoin ETF with the U.S. SEC under the name "iShare Bitcoin Trust." This move has attracted substantial attention not only in the world of Bitcoin and cryptocurrencies but also among traditional investment circles.
We believe that BlackRock's actions will not only bring new money into the market through ETFs but also raise general awareness about the existence of Bitcoin. It will instill greater confidence in this asset, making people more aware and encouraging them to delve deeper into understanding it, knowing that it's not a scam or deception.
Previously, Grayscale, VanEck, WisdomTree, and others have attempted to file for a Bitcoin Spot ETF with the SEC but faced multiple rejections due to various reasons. However, iShares, which has filed numerous ETF applications with the SEC, has had a remarkably high success rate. Their approval rate stands at 99.98% (Only one out of 575 filings being rejected).
Given BlackRock's track record and its significant influence in the financial world with over $9 trillion in assets under management (AUM), it's highly likely that they will be able to navigate the regulatory process with relative ease. BlackRock, as the largest asset management company globally, possesses considerable negotiating power with government agencies like the SEC, whether through direct or indirect means. Additionally, Larry Fink, the CEO of BlackRock, wields significant political influence. These factors have prompted many others who previously filed applications to resubmit them, as they believe that if BlackRock's application is approved, there would be no reason to deny theirs.
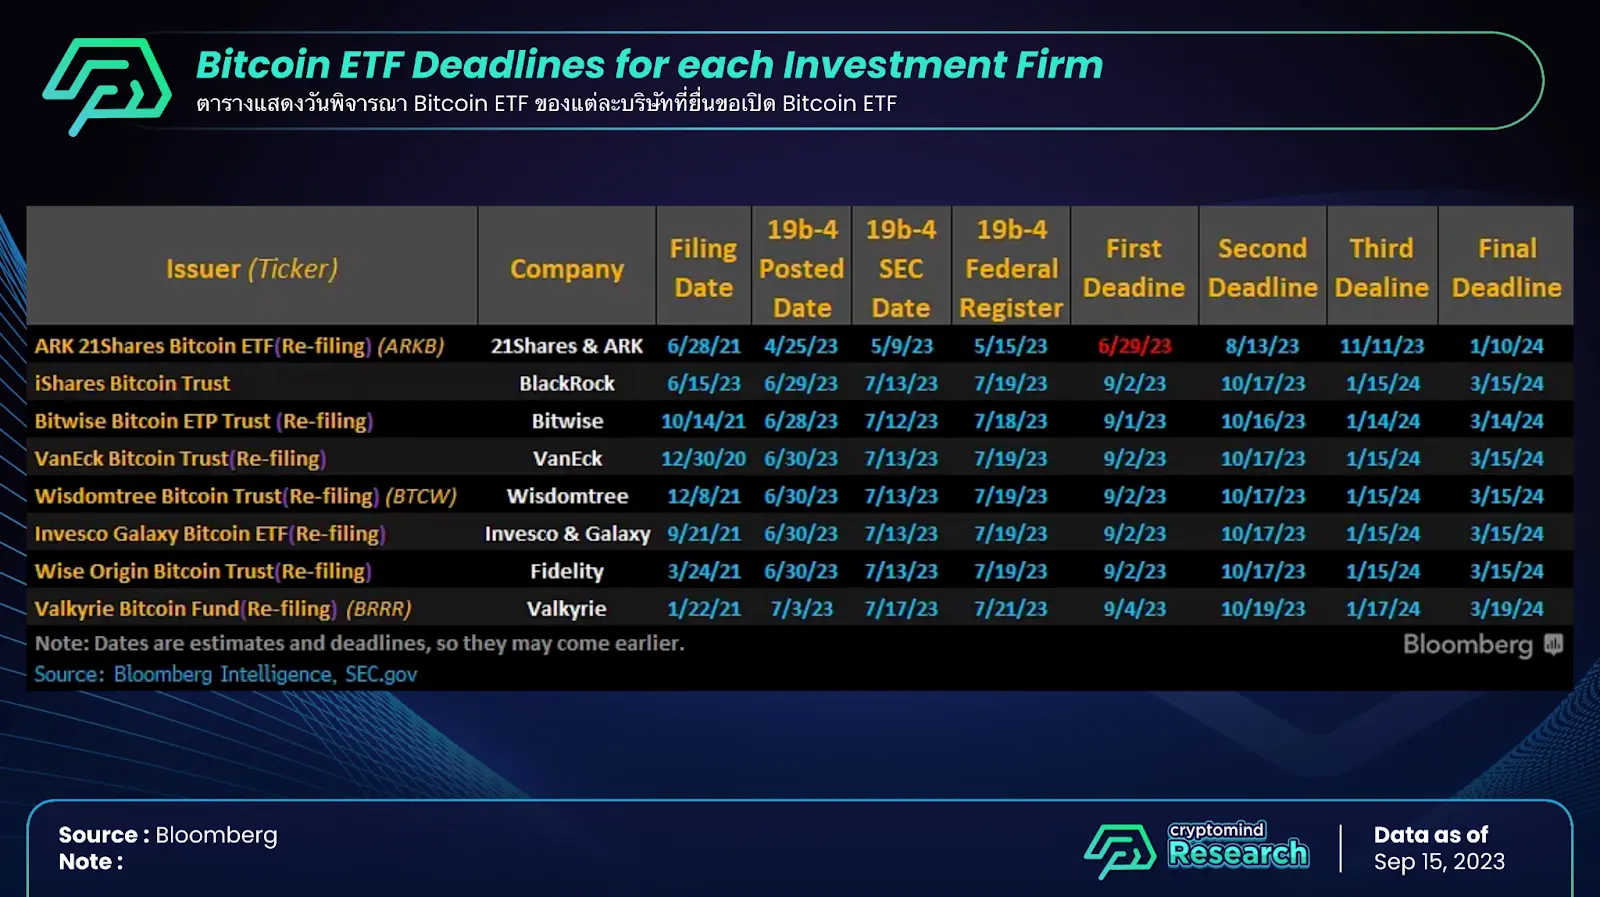
Regarding the timeline for the consideration of Bitcoin ETFs, the table above, compiled by Bloomberg, we anticipate that there is a high likelihood of delays in the first two instances for all the issuers. The periods to watch closely for will then be the third and fourth considerations, all of which fall in Q1/2024, which also corresponds to the period right before the Bitcoin Halving event.
However, it's important to note that all these anticipated factors need to align together. This includes an improving economic landscape and a more relaxed monetary policy from the United States. In the following section, we will delve into economic predictions for 2024 to gauge when such relaxation might occur.
3.2 Macroeconomic Outlook for 2024 by Merkle Capital
Merkle Capital, a subsidiary of the Cryptomind Group, is the first digital asset fund management business in Thailand that has received a license from the Ministry of Finance, following the recommendations of the SEC. As a digital asset fund manager, Merkle Capital provides services to manage digital asset funds, ensuring that investors can safely and optimally invest in the digital asset market.
With that, Merkle Capital has provided an overview of its macroeconomic predictions for the year 2024 as follows:
Factor 1: In the worst-case scenario, the Federal Reserve (FED) may raise interest rates only once in 2023.
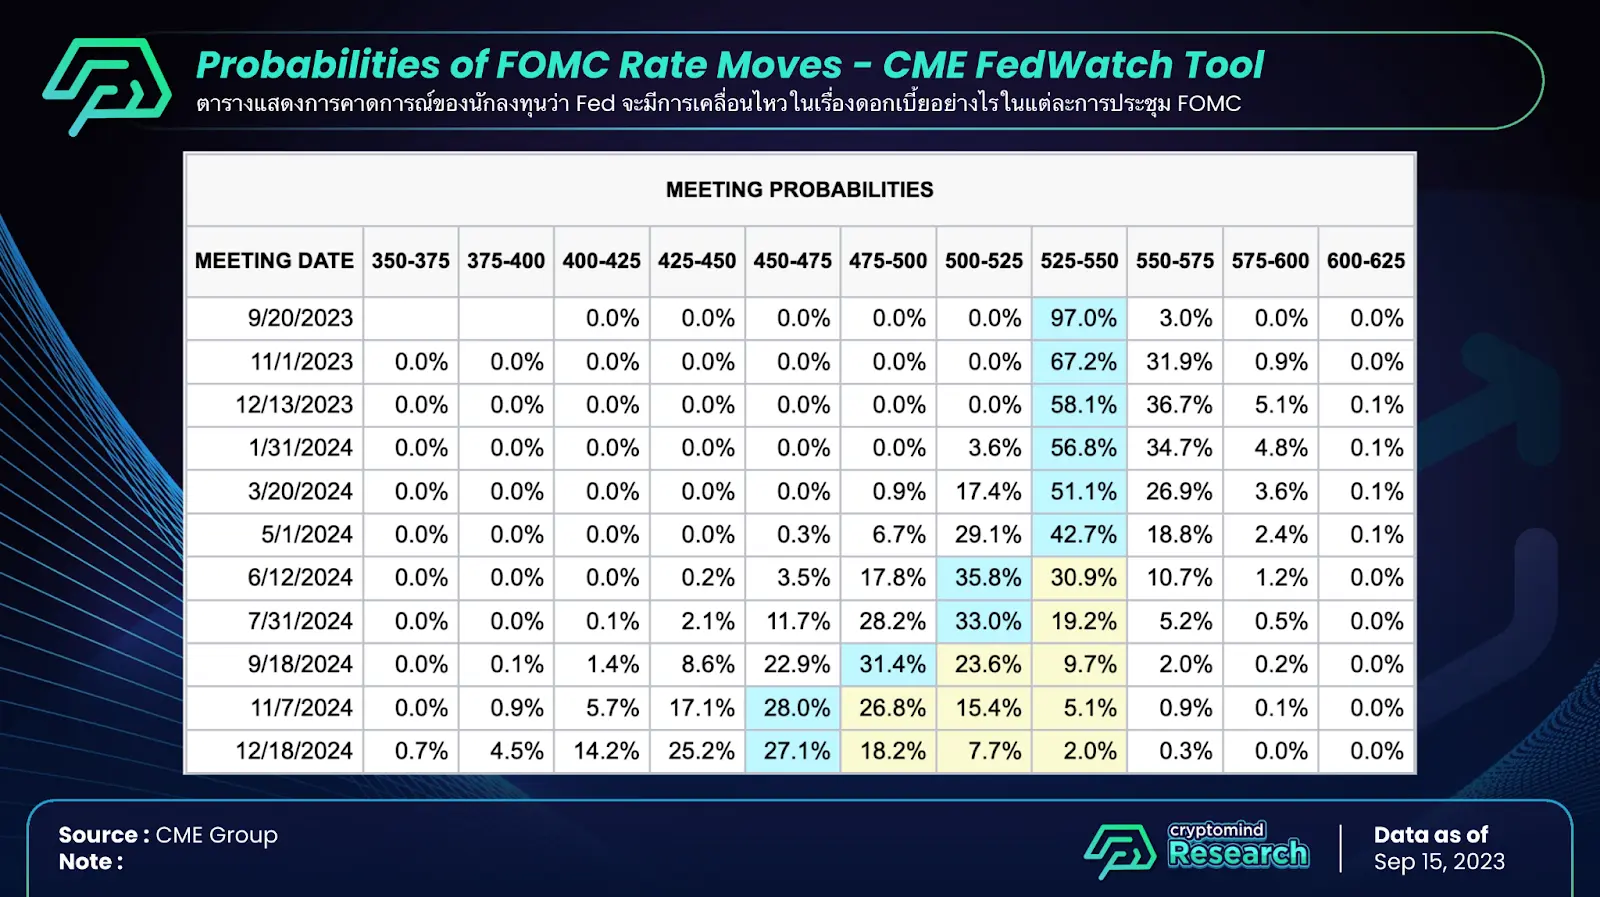
After Q4 2023, the headline CPI inflation figures may face pressure from factors in the energy sector due to reduced oil production from Russia and Saudi Arabia, leading to an increase in energy prices. This, in turn, may contribute to higher everyday expenses for the U.S. population. From the chart above, it can be observed that most investors are still divided on the Federal Reserve's interest rate hikes, especially in November and December 2023. However, in the worst-case scenario, we believe the Fed might raise interest rates only once more. Going beyond this could potentially impact the overall economy, especially the increasing volatility in 2-year, 5-year, and 10-year Treasury yields, affecting the banking sector once again.
Due to these reasons, the market outlook for the first half of 2024 suggests that there is a possibility the Fed might consider reducing interest rates. If the interest rates remain unchanged during Q4 2023, as seen in the chart, more than 17.4% and 29.1% of investors are starting to consider the possibility of a rate cut by the Fed in the FOMC meetings in March and May 2024, respectively. Apart from interest rates, we also believe that there is a "possibility" that the Fed might initiate other monetary policy relaxations, such as reducing the pace of quantitative tightening (QT) or halting QT altogether. This factor could potentially lead the market to embrace more risk once again.
Factor 2: Core Inflation figures are showing a downward trend on a broader scale.
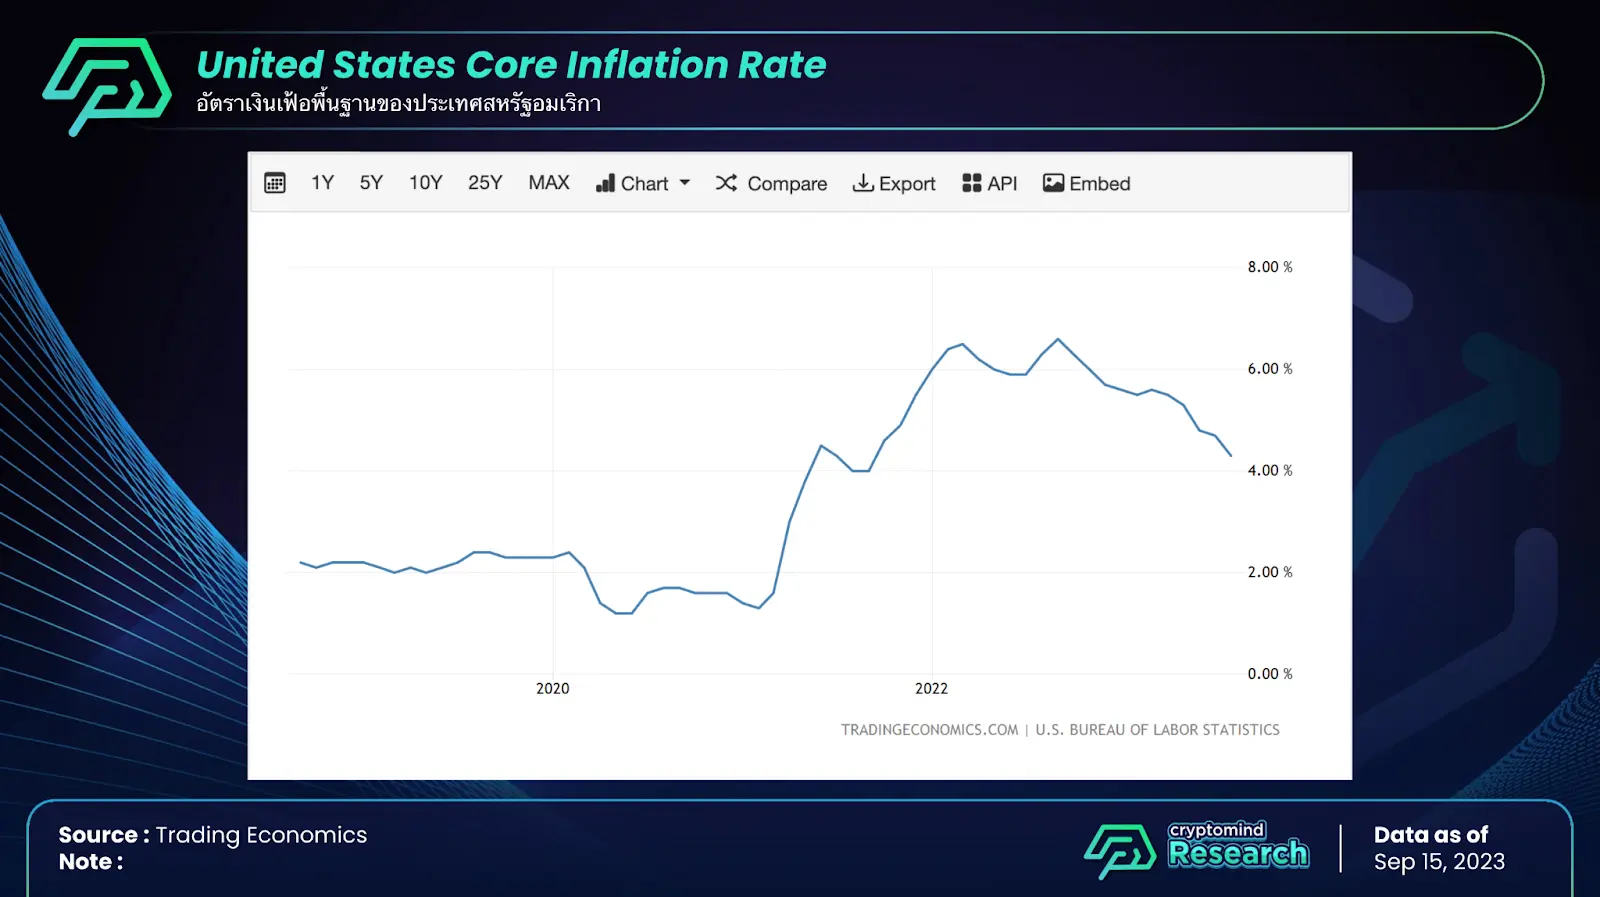
From the chart, it is evident that the Core Inflation rate, which excludes energy and food, has begun a noticeable downward trend. This suggests that the Fed's interest rate hikes in 2022-2023 and the previous rounds of Quantitative Tightening (QT) have started to have a more pronounced impact. The Fed's goal of bringing the Core Inflation rate down to levels close to those before the COVID pandemic, around 2%, may not be too far off (considered successful if it drops below 4%). If the Fed can also achieve a balance between labor and interest rate markets, leading to a soft landing for the U.S. economy, it would provide sufficient reasons for the capital markets to see increased liquidity and a higher appetite for risk-taking in 2024.
Factor 3: US Employment Rate Returns to Pre-COVID Levels
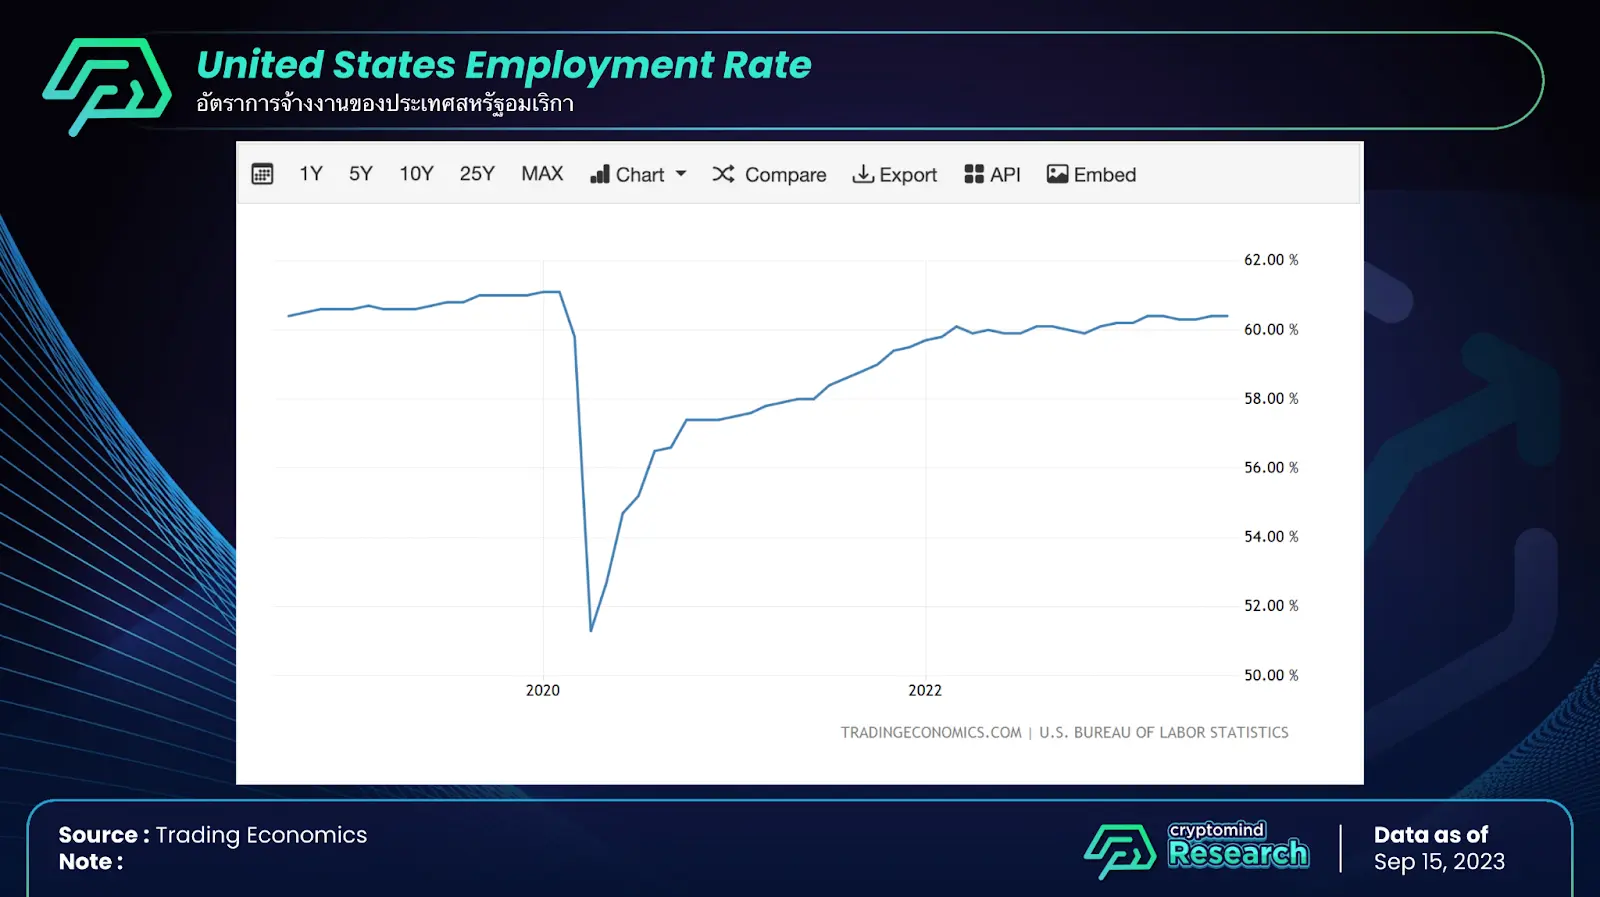
From the chart, it can be observed that the labor market, as indicated by the Employment Rate, is gradually returning to pre-COVID levels. After declining in 2020, it has been steadily increasing in 2021 and 2022. This picture signals that the American labor market is recovering and has a job count approaching the pre-pandemic levels. Although there are still concerns about inflation, the overall outlook suggests that the U.S. economy is getting closer to a soft landing or possibly no landing at all. If the Federal Reserve can continue to manage the labor market and inflation effectively in this direction, it raises the possibility that in 2024, the U.S. economy may recover faster than other countries after facing disruptions since 2020.
Factor 4: US Labor Income Growth Returning to Equilibrium
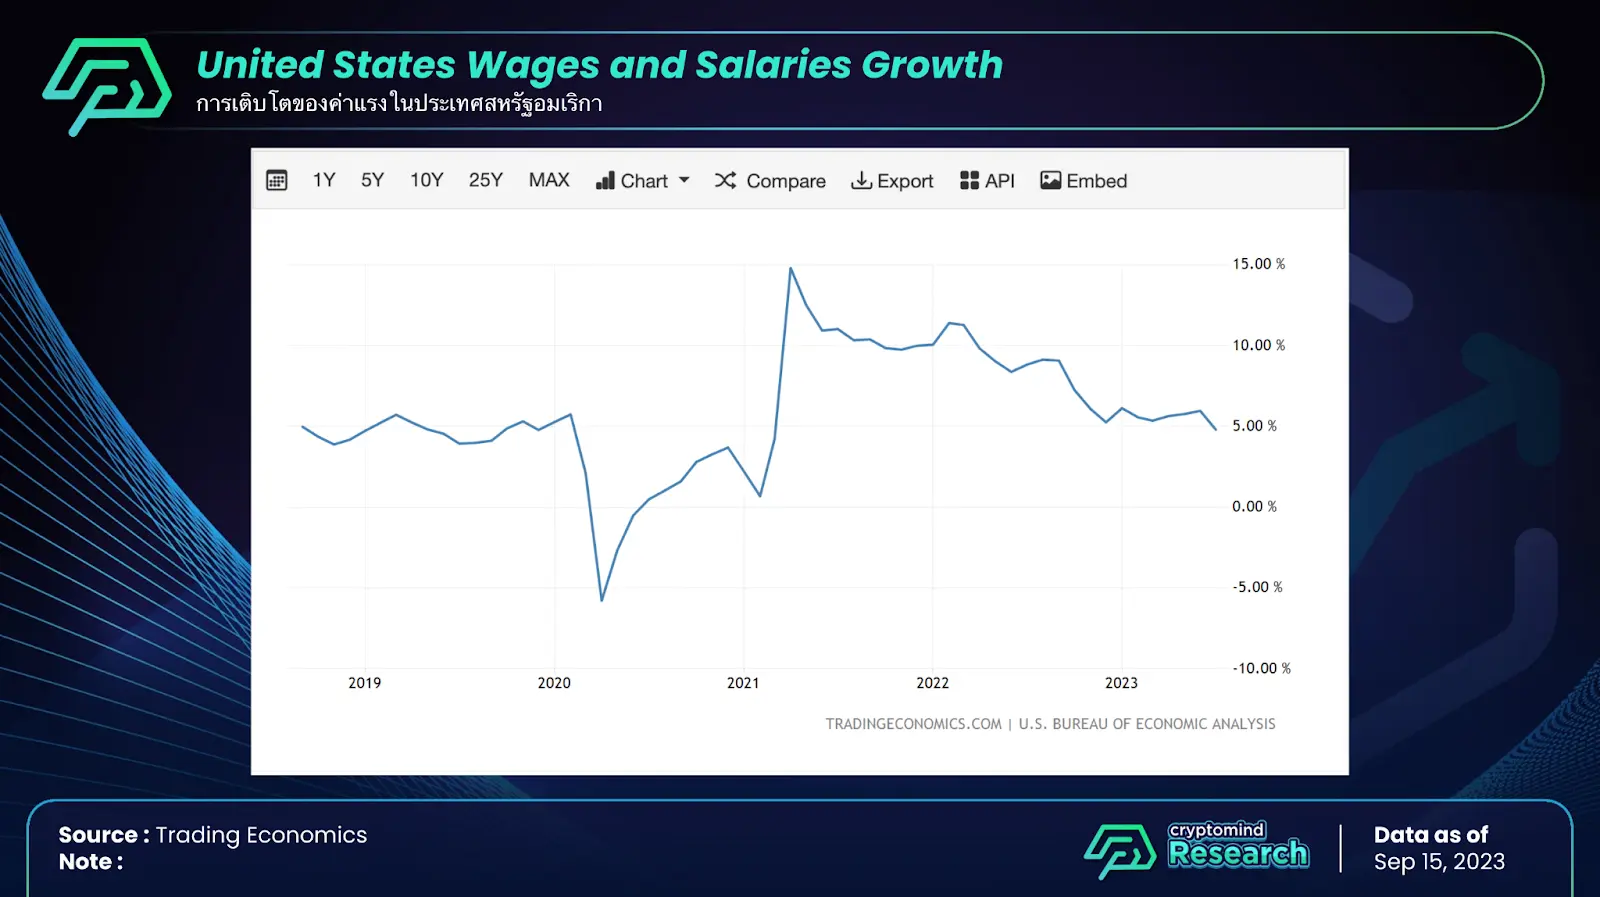
Another critical factor indicating the return of the US economy to normalcy is Wages and Salaries Growth. During the period of heavy monetary stimulus by the FED, wages and salaries were pushed higher, leading to increased production costs and prices of goods. However, as seen in the chart above, since reaching its peak in 2021, income growth for US citizens has started to decline significantly. This trend can be attributed to the Federal Reserve's adoption of tighter monetary policies, including interest rate hikes and quantitative tightening, forcing businesses to reduce prices due to reduced economic flexibility. Currently, income growth for US citizens has returned to levels observed before the COVID-19 pandemic, suggesting that the inflationary impact of wage increases may have subsided.
Conclusion
Factors such as the central bank's interest rate (Fed Fund Rate), real inflation growth (Core CPI), employment rate, and wage growth are crucial indicators that provide insights into the overall state of the United States economy. Analyzing these data points reveals that the economy is beginning to recover and return to normality after being impacted by the COVID-19 pandemic.
If the central bank (FED) can maintain a balanced labor market and effectively control inflation, there may be opportunities for increased capital inflow into the stock market in 2024. Additionally, global investors are likely to become more risk-oriented in their investment decisions.
4.Technical Analysis by Cryptomind Advisory
In addition to the various factors mentioned earlier, conducting Technical Analysis on the charts is another approach that can boost confidence in trading. When examining historical price charts, it becomes evident that there is a high likelihood that the lowest points have already passed.
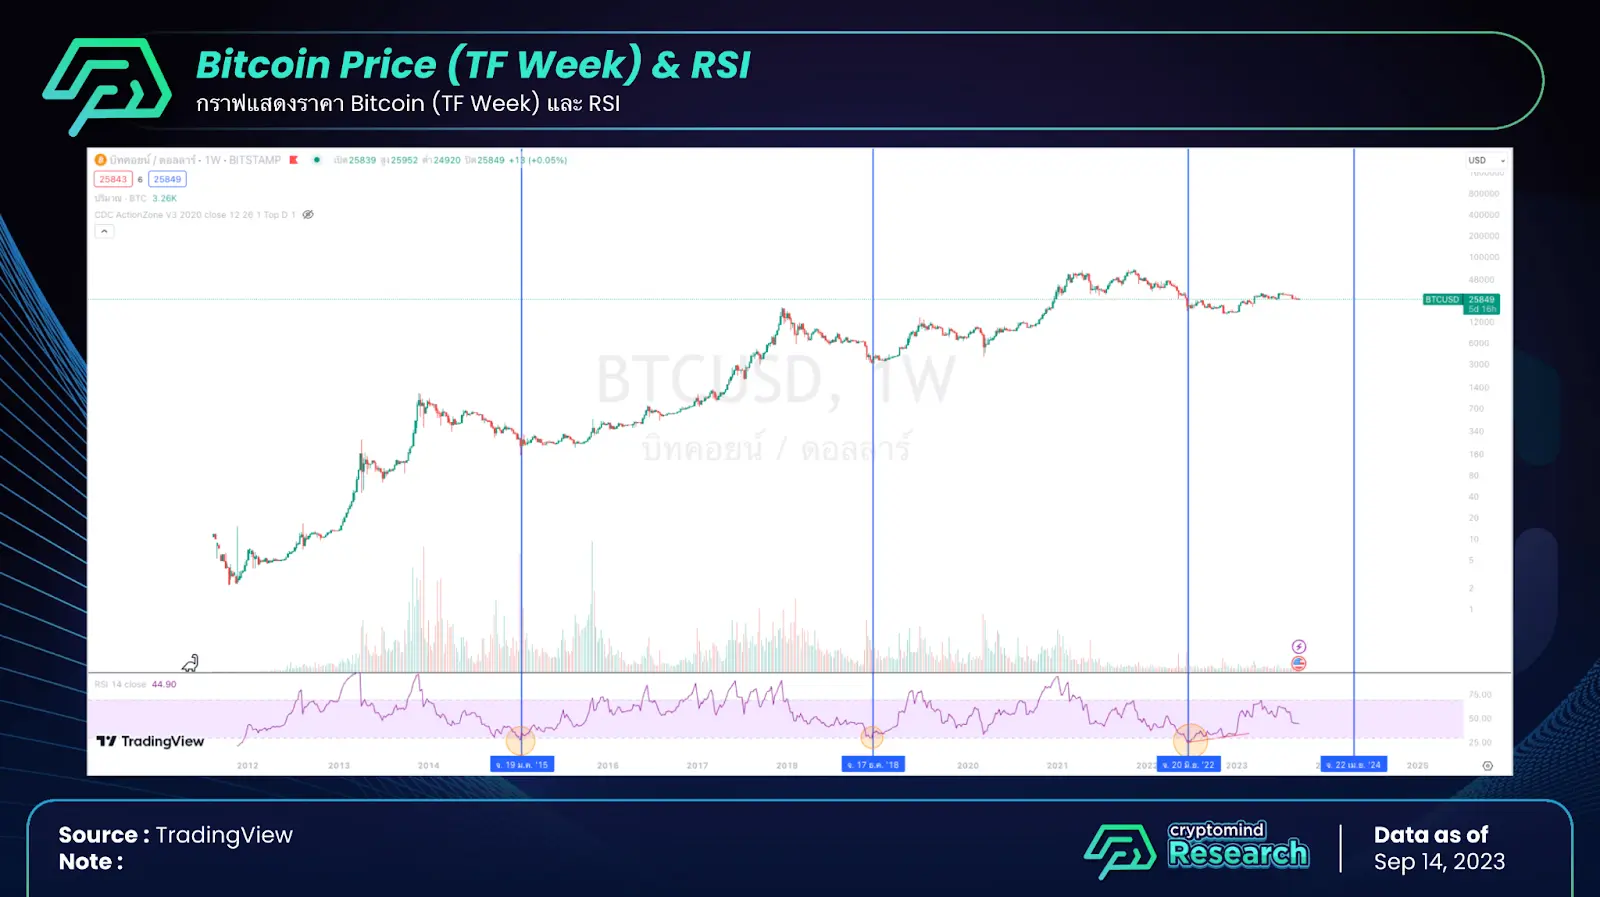
Given that the Relative Strength Index (RSI) on the weekly timeframe (TF Week) enters oversold territory in the middle to late June 2022, it's worth noting that during the two previous cycles, this oversold period was closely followed by price reaching its lowest point for that respective cycle. While there was a subsequent corrective phase, the RSI eventually started to climb higher, signaling a bullish divergence, a pattern often observed by many traders as an indication of a potential price reversal.
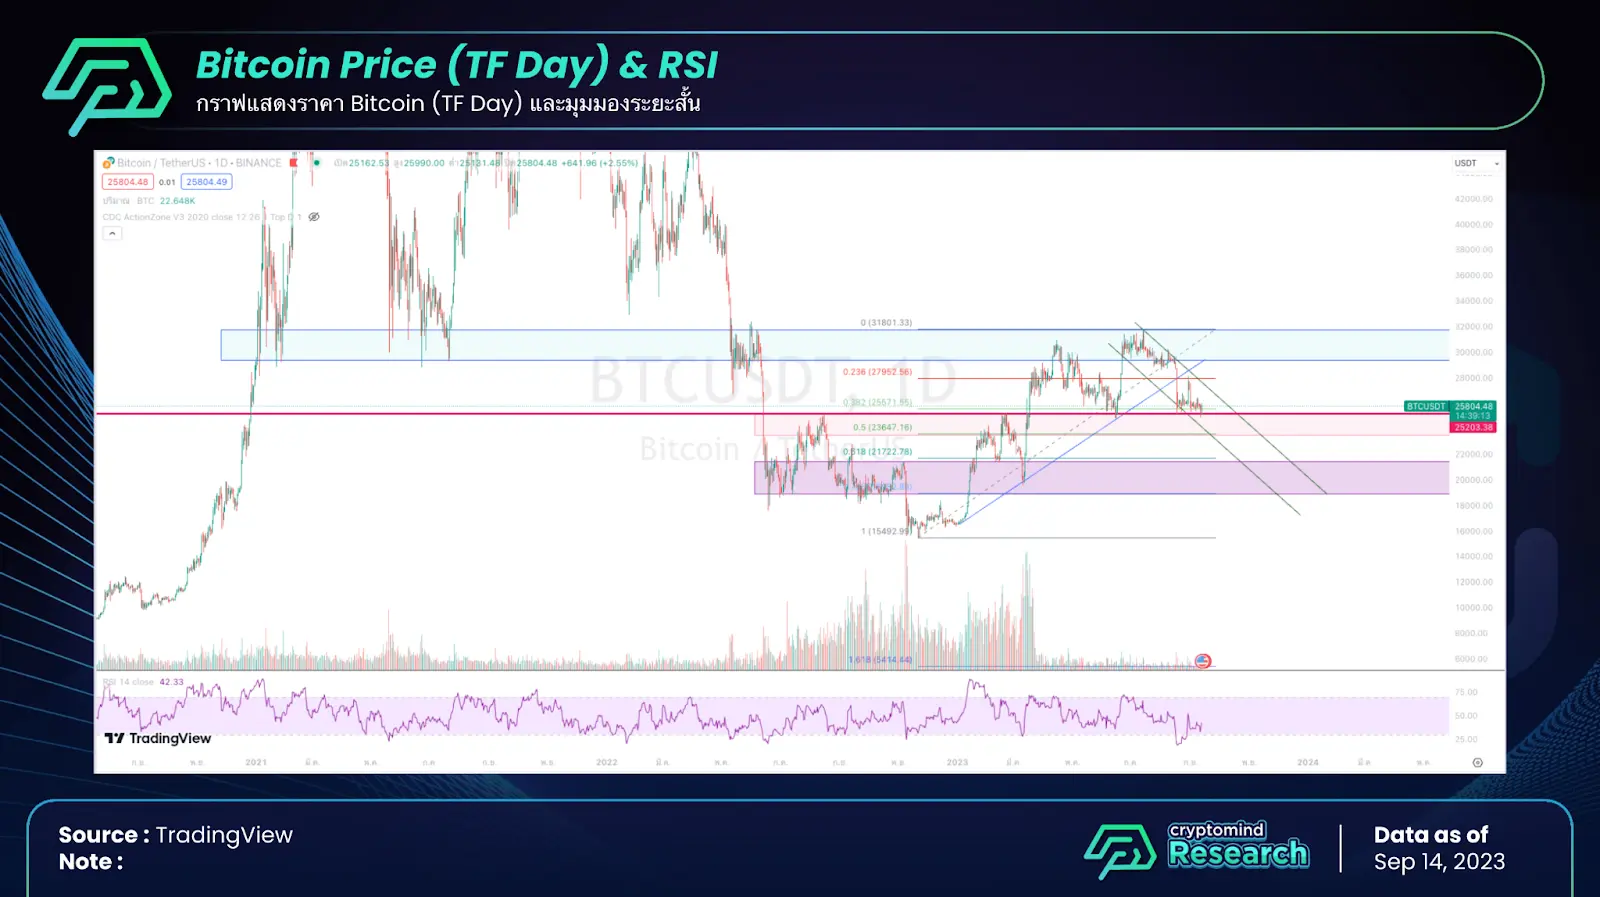
For the short-term analysis on the daily timeframe (TF Day), Cryptomind Advisory observes that the cryptocurrency is currently in a consolidation phase after a significant upward adjustment that started in early 2023 and brought the price up by almost 100%. At this point, the price has fallen below a major trendline and is trading around the price of $25,000. This price range serves as a strong support level, and if it holds, it could keep Bitcoin from losing its upward trend. However, instead of resuming an upward trajectory, the price may move sideways within this wide range between $25,000 and $31,000.
However, if it breaks below the support level of $25,000, it could potentially fall to $20,000 or even lower, but it’s unlikely to make a new low. In summary, in the long term, it is expected to be a sideways movement, a consolidation zone in the broader range of $16,000 - $31,000. If there is no major catalyst to push the market price out of this range, either positively or negatively, the price range of $16,000 - $31,000 is a range worth considering for accumulating more Bitcoin.
5. Interesting on-chain data of Bitcoin
In the world of Blockchain where everyone can see transactions occurring on the network equally, it allows us to analyze the data on the network freely. This might lead us to find interesting information to support investment decisions. In this article, 2 indicators that we think are interesting during this period will be presented.
5.1 Market Value to Realized Value Ratio (MVRV Ratio)
The MVRV Ratio is one of the on-chain indicators that we are particularly interested in considering when it is a good time to accumulate. The MVRV Ratio is the ratio between the market value of Bitcoin that has been transferred in the last 5 years (Market Value) and the total value of Bitcoin the last time it was transferred on-chain (Realized Value).
The MVRV value can indicate where the fair value of Bitcoin is, or put simply, if this value is high, it means many people bought it at a low price and the current price of Bitcoin is expensive. There is a chance that Bitcoin will be sold to make profits. If this value is low, it means we can accumulate at a price cheaper or equal to others.
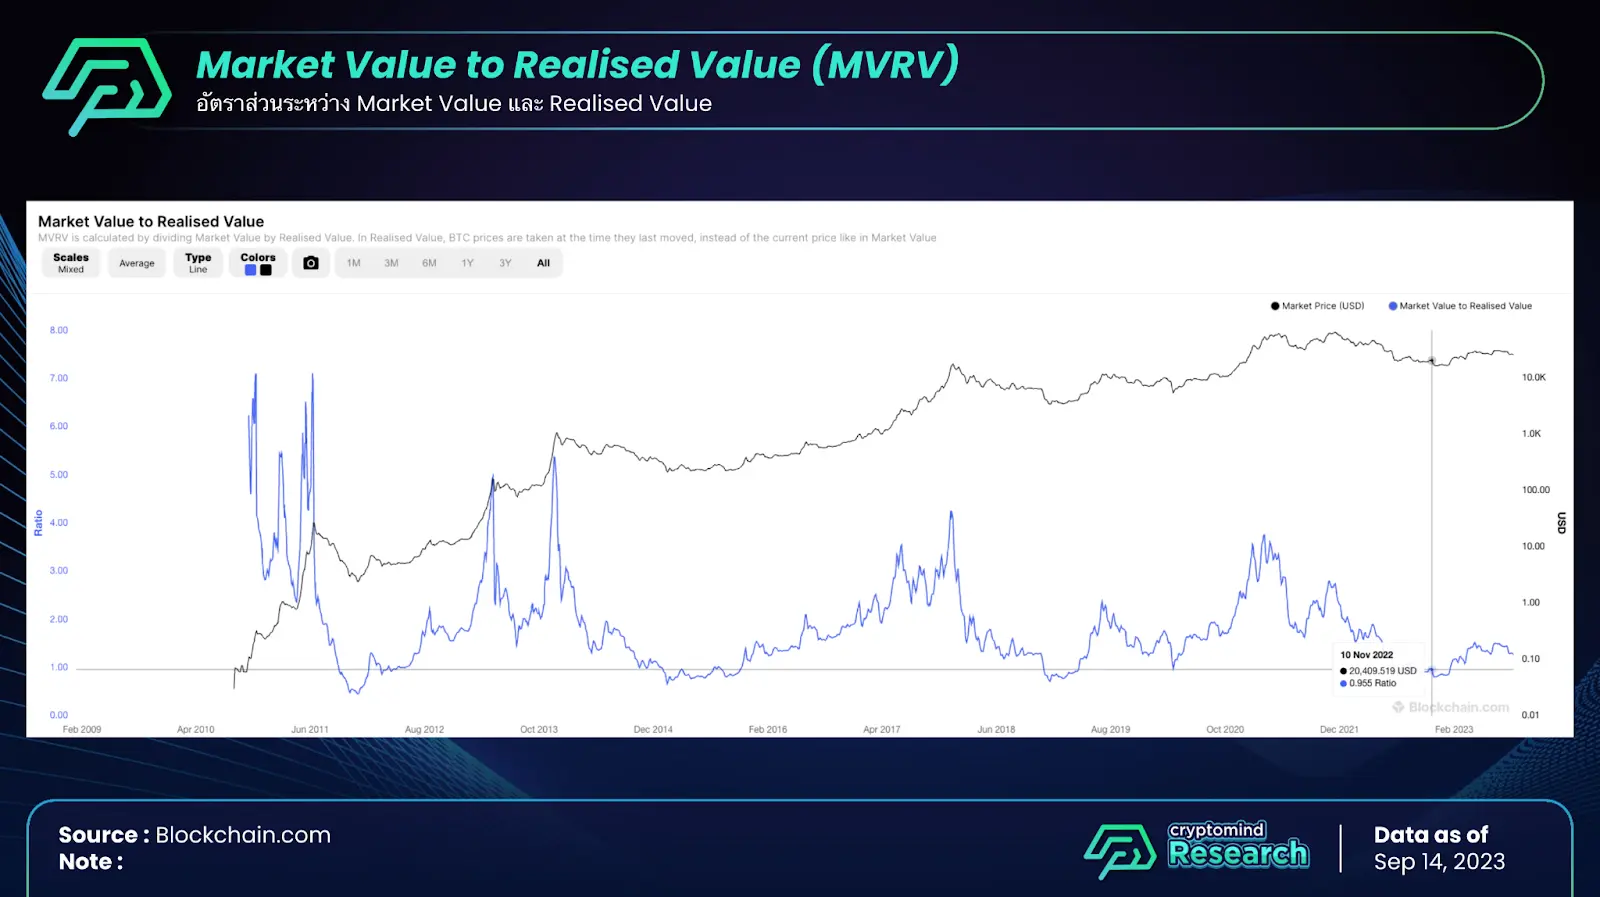
If the MVRV value exceeds 3 for a prolonged period, it signals a danger that an economic bubble might be forming in the market. Looking back, this aligns with the economic bubble periods in early 2018 and mid-2021, when the price of Bitcoin reached its peak at those times. So, when the MVRV Ratio is above 3, it's a good time to gradually take profits.
But if this value is less than 1, it indicates the best buying signal for Bitcoin. Looking at historical statistics, it can be seen that the periods when the price of Bitcoin hits its lowest coincide with the MVRV Ratio being less than 1.
And currently, the price is in the adjustment phase with the MVRV Ratio dropping to around 1.27, which is considered a good accumulation phase. This also aligns with the factors in Technical Analysis.
5.2 Bitcoin Balance in Centralized Exchanges
Another on-chain data of Bitcoin that we are interested in and have chosen to feature in this article is the "Number of Bitcoin held in Centralized Exchanges." Coinglass has collected data from the top 20 leading exchanges.
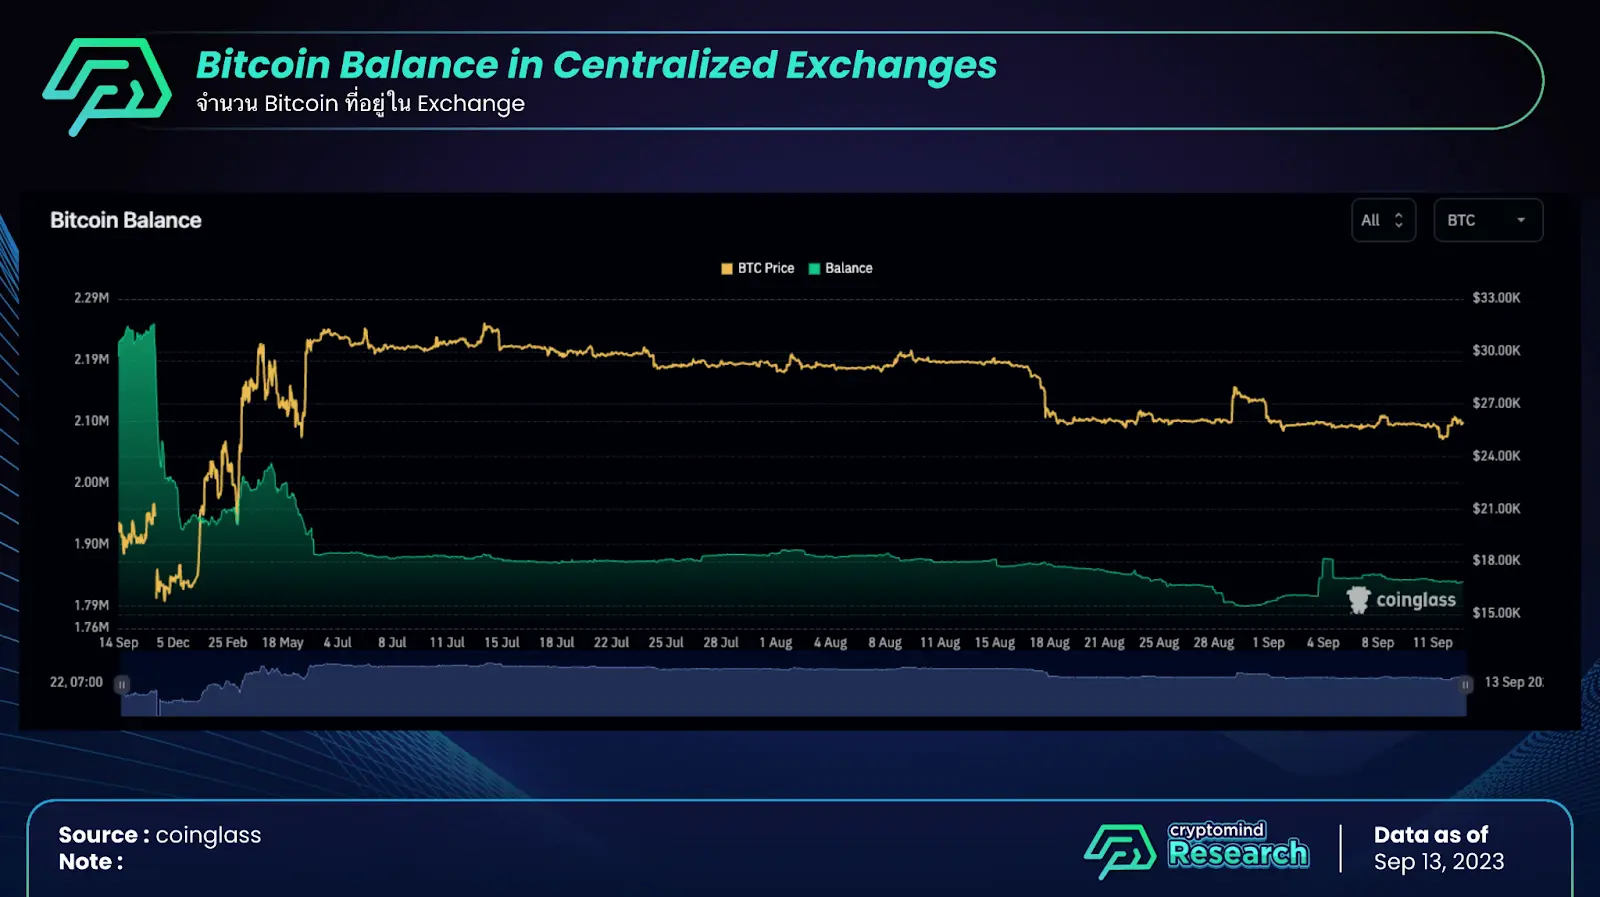
From the graph, it can be seen that currently, there are only about 1.84m BTC left in Centralized Exchanges since the end of 2022, where we estimated the price to be at its lowest point in the cycle. At that time, there were 2.26m BTC in the exchanges, or a decrease of 18.584%.
The reduction mentioned is expected to be due to many people fearing exchange issues, as in the case with FTX, leading them to withdraw Bitcoin from the exchanges to store it themselves. Another part is that people are gradually accumulating Bitcoin continuously.
The decrease in the number of Bitcoin in Centralized Exchanges also leads to reduced liquidity. Currently, the 1.84m BTC accounts for only about 9.44% of the 19.49m BTC circulating supply. This means that if there is significant buying power entering the market, whether from financial firms or individual investors, it can easily push the price up because the supply available for trading is much less than the demand.
An Interview with Mr.Peeraphat Hankongkaew (CIO-Cryptomind Advisory)
Mr.Peeraphat Hankongkaew is currently
-
Chief Investment Officer (CIO) of Cryptomind Advisory
-
Owner of the facebook page “Blockchain Review”
-
A member of the Thai Digital Asset Association board.
-
the author of numerous best-selling books on Bitcoin and cryptocurrency in Thailand, including "Bitcoin & Blockchain 101: Digital Money that Changes the World", "Digital Asset 101: From Bitcoin to Investing in Digital Assets", and “DeFi Farming 101: An Investment Journey for Digital Farmers".
-
The translator of the book “The Bitcoin Standard : The Decentralized Alternative to Central Banking.”
Q : Will the crypto market rebound post-Bitcoin Halving according to the 4-year Cycle theory, as has happened in the past?
A: From my personal perspective as someone who has invested in the crypto market, I tend to give more weight to macro factors than to the fundamental factors of each individual coin. This is because although the market might seem large, it is still small compared to other global markets and has liquidity that can be settled by whales, making it quite volatile.
Hence, in a normal situation without a major cryptocurrency event, macro factors are seen as the major elements influencing Bitcoin's price. We believe that the period around the Bitcoin halving will be favorable, as there will be major events like the ETF and the Bitcoin Halving, followed by the potential macro development of interest rate cuts in late 2024.
However, the macro market is always uncertain. Even with the abundance of major crypto events, if the macro environment doesn't rebound, it's still challenging for the crypto market to enter a full bull run. But we have to admit that given the current situation, the sentiment around the middle of next year is expected to be quite positive.
Asset Allocation for BTC Halving & Opportunity by Elkrem Capital
Who is Elkrem ?
Elkrem Capital is a DeFi wealth manager, a digital asset manager specializing in DeFi. Elkrem manages digital assets related to DeFi for investors. Moreover, Elkrem also helps investors invest in digital assets through the DeFi platform conveniently. Along with facilitating investors to be able to invest in the digital asset market safely and receive benefits in the form of Yield Farming at the highest level.
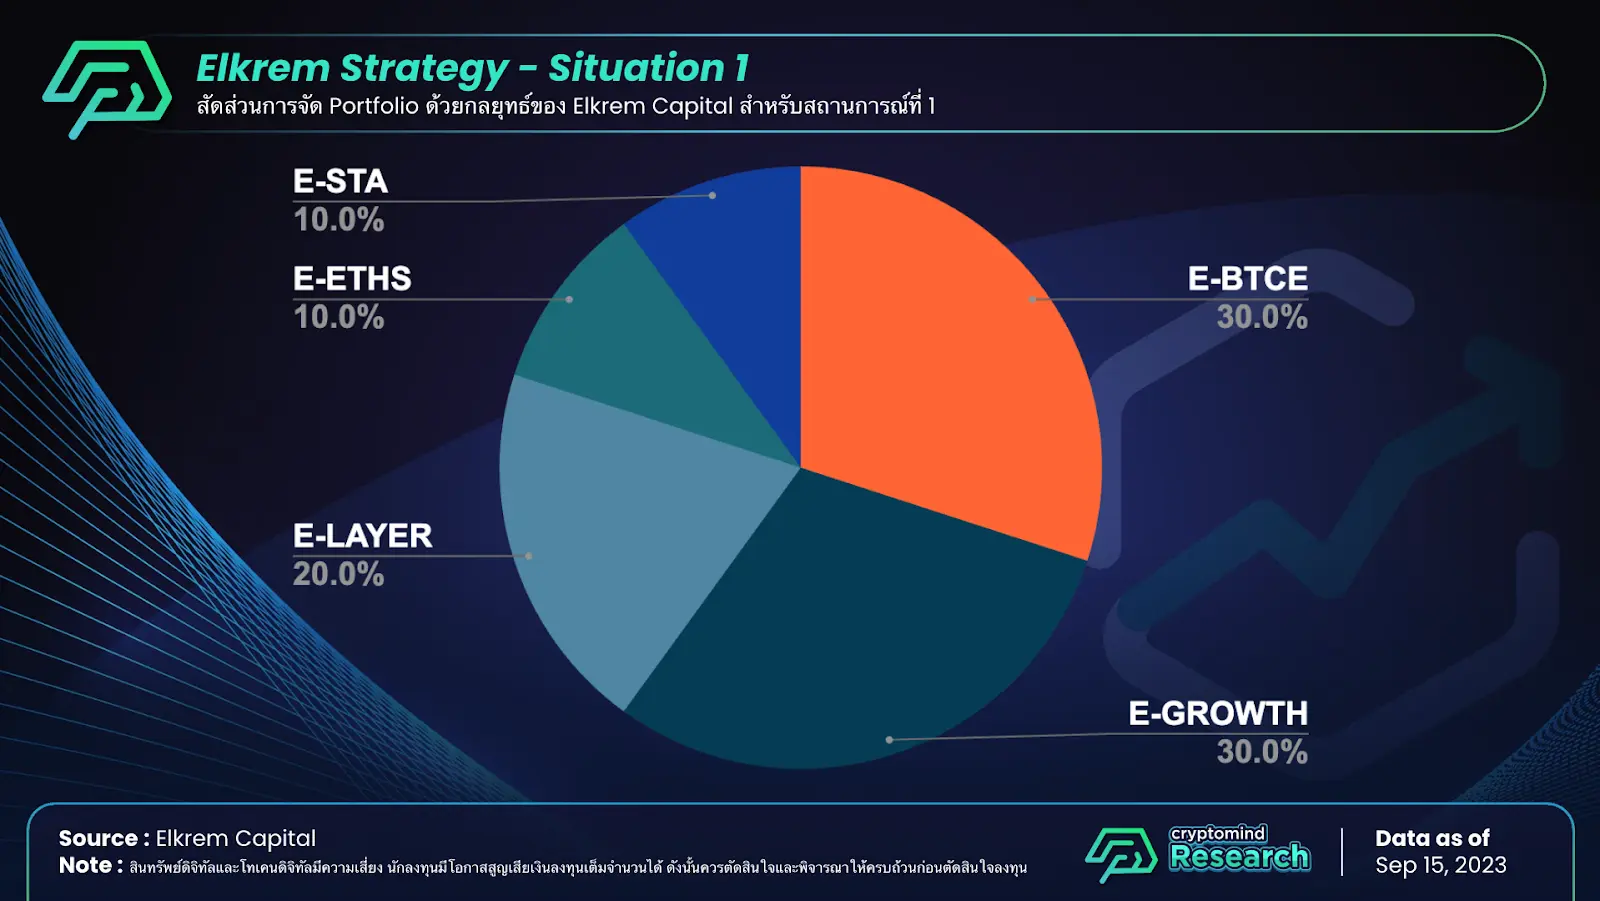
Due to the Bitcoin Halving Narrative and factors of the Bitcoin Spot ETF that have a chance of passing and occurring at the end of the year and the beginning of 2024, Elkrem would like to present the Portfolio proportions that are suitable for receiving the narrative mentioned above as follows:
Situation 1: When the price of Bitcoin moves with the above narrative, it may cause Bitcoin Dominance to increase. Therefore, during times when Bitcoin Dominance is in the zone of more than 45, it is recommended to have a large proportion of Bitcoin in order to get the maximum benefit from it. Moreover, Investors and have some portion of Stablecoin reserved for use in allocation in the case of a short-term Bitcoin price decline. to average prices (It is not recommended to buy just one time) and hold a small proportion of good fundamental Altcoins such as Ethereum.
E-BTCE 30% (Buy at the beginning round of 2024)
E-GROWTH 30%
E-LAYER 20%
E-ETHS 10%
E-STA 10%
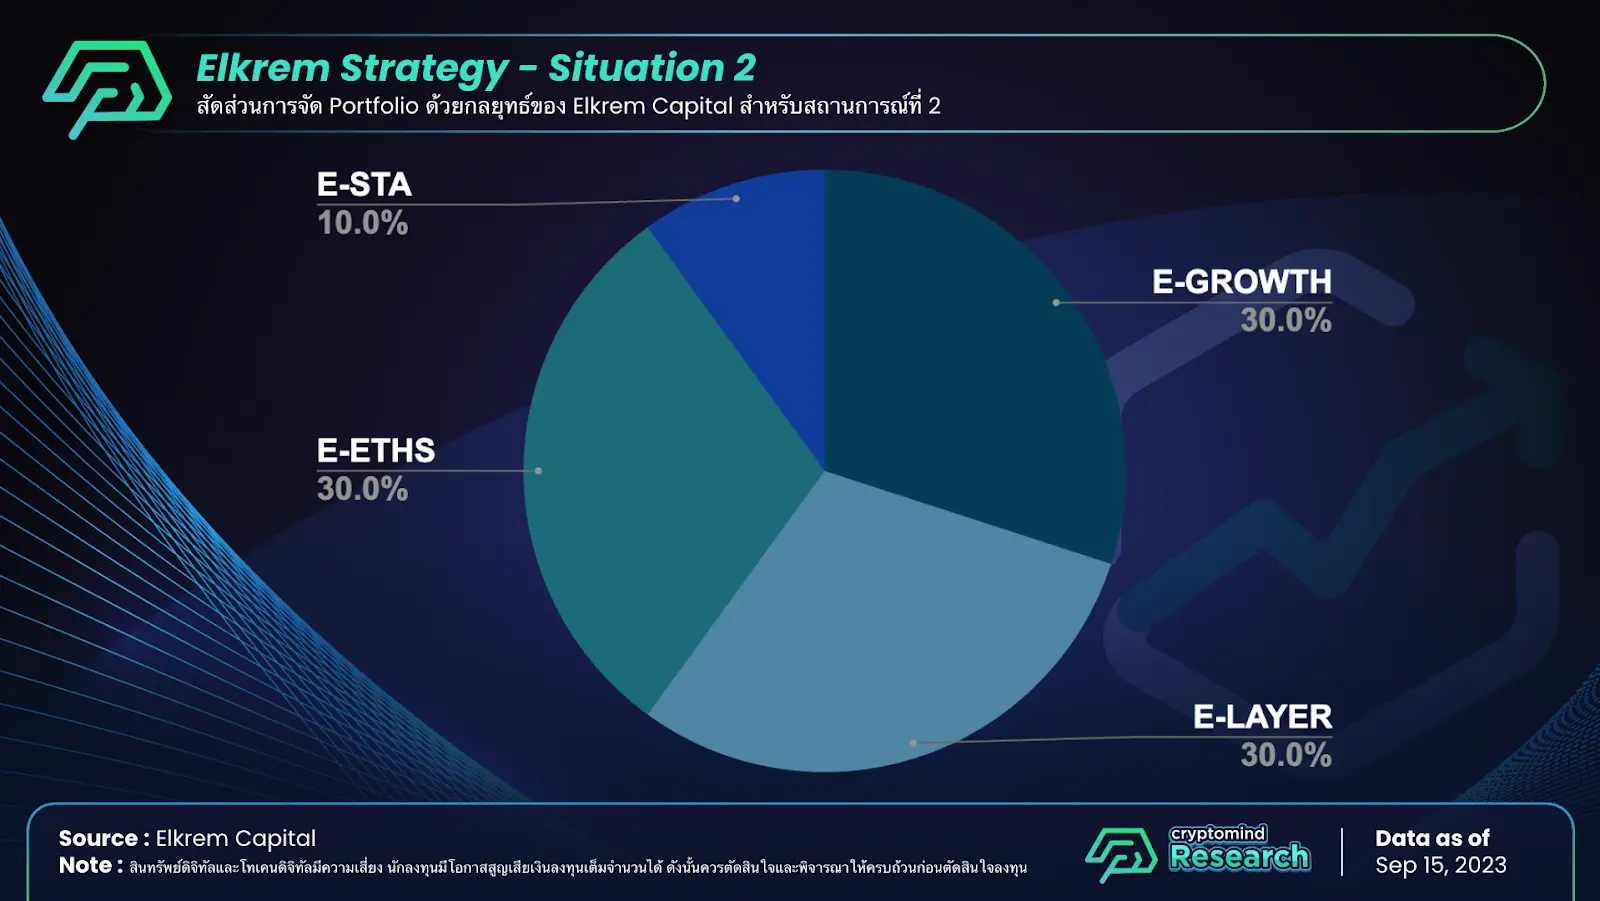
Situation 2: When Bitcoin Dominance drops below 44 and 40, more money is beginning to flow to Altcoins. At that point, investors should start shifting some of their Bitcoin and Stablecoins to Altcoins. This move is to allow investors to maximize returns during the Altcoins Season. However, investors should maintain a proportion of Bitcoin and Stablecoins to reduce drawdowns in unexpected situations and take into account the opportunity to buy more digital assets during unexpected situations.
E-GROWTH 30%
E-LAYER 30%
E-ETHS 30%
E-STA 10%
Disclaimer
I confirm that I have read and understood the following: The information contained in this article is strictly the opinions of the author(s). This article was authored free from any form of coercion or undue influence. The content represents the author's own views and does not represent the official position or opinions of CrossAngle. This article is intended for informational purposes only and should not be construed as investment advice or solicitation. Unless otherwise specified, all users are solely responsible and liable for their own decisions about investments, investment strategies, or the use of products or services. Investment decisions should be made based on the user’s personal investment objectives, circumstances, and financial situation. Please consult a professional financial advisor for more information and guidance. Past returns or projections do not guarantee future results.
Xangle or its affiliated partners own all copyrights of the written or otherwise produced materials and content provided on the platform. Any illegal reproduction of such content, including, but not limited to, unauthorized editing, copying, reprinting, or redistribution will result in immediate legal actions without prior notice.


