Will the Market Maintain a Bearish Bias Until Year-End? What Lies at the Core of Market Dynamics?


Last week’s hawkish tone from the Federal Reserve in their inflation report is not expected to significantly alter the Fed’s policy stance, as evidenced by the modest rise in bond yields. The S&P 500 and Nasdaq Composite indices both experienced their second consecutive weekly declines, falling by 0.2% and 0.4%, respectively. The largest drop occurred on Friday, marking the largest single-day decline in three weeks, after a relatively positive market sentiment in the preceding weeks.
The strike by the UAW automotive union on Friday was a direct trigger and marked the first time in the union’s 88-year history that it took simultaneous action against the three major automakers.
Additionally, the Philadelphia Semiconductor Index plummeted by 3% on Friday, with reports suggesting that TSMC (Taiwan Semiconductor Manufacturing Company) might delay equipment deliveries to its Arizona factory due to cautious demand prospects. Adobe, a software company, reported better-than-expected financial results but unexpectedly saw a significant decline on Friday, further contributing to investors’ increased caution regarding the technology sector. After a 25% surge in its IPO on Thursday, Arm, a popular chip design company, saw its stock price drop by 4.5% on Friday.
Rising oil prices have exacerbated pessimism, with oil prices surpassing $90 per barrel, reaching a new annual high. WTI crude oil increased by 3.5% for the entire week, while Brent crude oil increased by 3.8%.
Simultaneously, rising U.S. Treasury yields continued to weigh on the stock market, with the 10-year Treasury yield climbing to 4.32%.
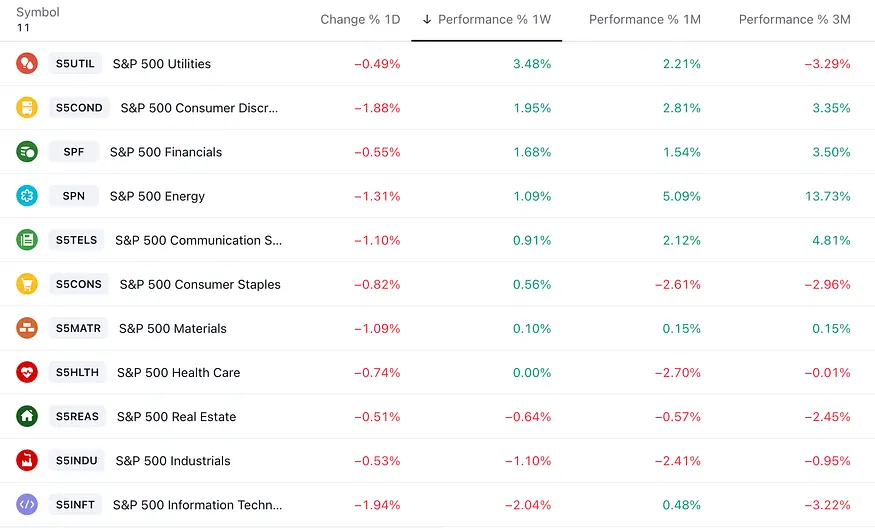
In terms of sector performance for the week, utilities (+3.5%), non-essential consumer goods (+2%), and financials (+1.7%) showed the strongest performance, while industrials (-1.1%) and information technology (-2%) were the weakest performers.
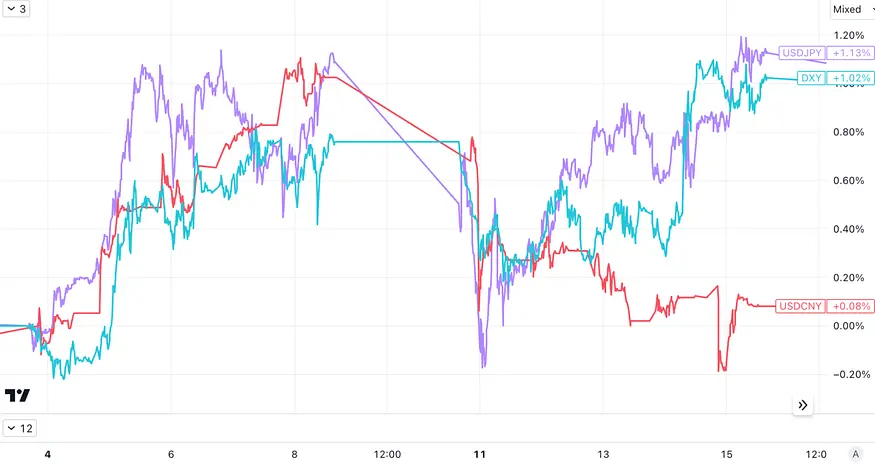
In the foreign exchange market, the U.S. dollar index initially declined but later rebounded, marking its ninth consecutive week of gains and reaching its highest level since March. It briefly touched 148 against the Japanese yen, a high not seen since November of the previous year. However, the Chinese yuan exhibited strength over the past week, with the USDCNY rate briefly dropping to 7.25, marking its lowest level since early August.
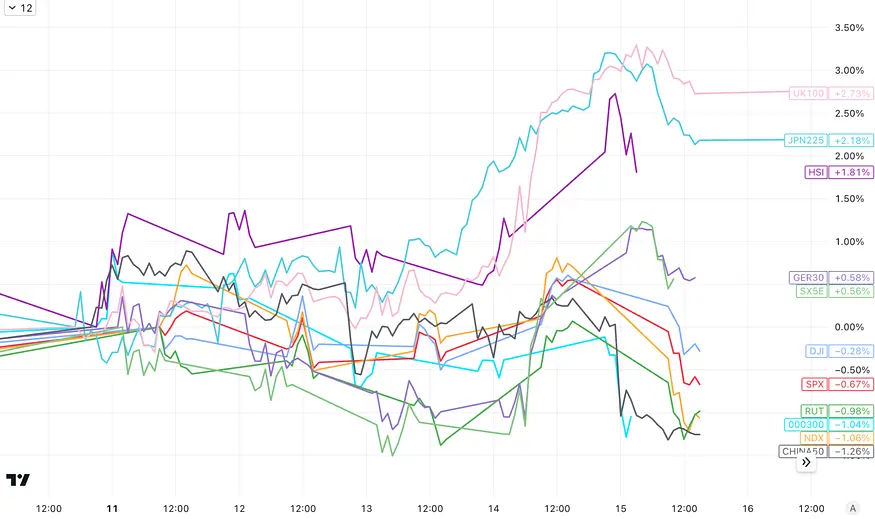
In other stock markets, Hong Kong, Japan (with the JPN225 reaching its highest level since July thanks to strong interest in technology stocks following Arm’s successful listing), the UK (with the UK100 hitting a new high since June), and European stocks (Stoxx50 with a 0.6% increase) showed strong performance. However, mainland Chinese stocks in the Shanghai and Shenzhen 300 index recorded their third consecutive weekly decline.
So far in 2023, we have not seen a correction of the 10% magnitude, which typically occurs at least once a year. Therefore, if we witness a deeper retracement in September and October, historically weaker months, it would not be surprising (the stock market may also consolidate for some time rather than declining outright). However, in the short term, we do not see any significant economic or financial risks, so any major declines could be viewed as buying opportunities for long-term investors.
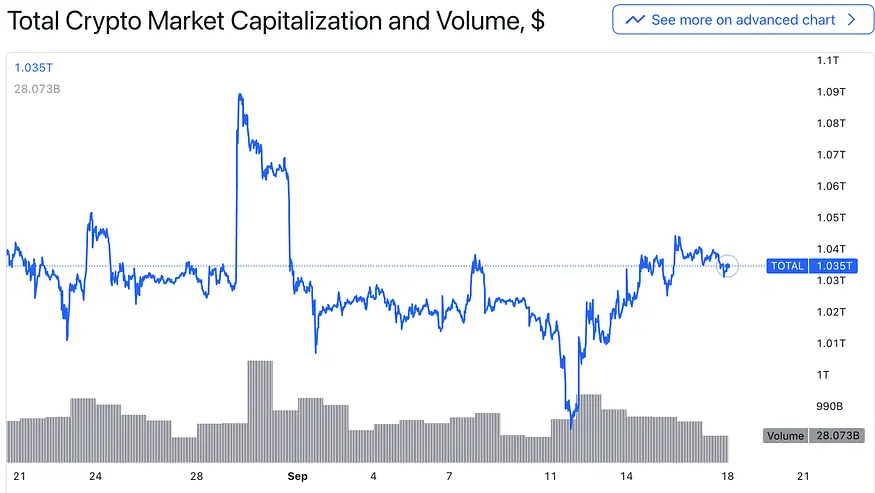
In the cryptocurrency market, there was a rebound after a significant drop on Monday, which was primarily attributed to the ongoing fallout from the $34 billion crypto asset liquidation on FTX. However, when the news was confirmed on Thursday, the market did not experience a significant downturn. More detailed analysis was provided during Thursday Muse morning meeting.
Important Financial Events
[European Central Bank Raises Interest Rates by 25 Basis Points, but Hints Rates May Have Peaked]
On Thursday, the European Central Bank (ECB) increased its benchmark interest rate by 0.25 percentage points to 4%. This marks the tenth consecutive rate hike since the ECB began rapidly raising rates from below zero last year. ECB President Lagarde implied that Thursday’s rate hike might be the final one in this cycle, leading to a sharp decline in the Euro and the U.S. Dollar Index surging past 105.3, reaching its highest level since the March crisis. However, Lagarde also emphasized that it’s currently unclear whether rates have reached their peak, and she did not mention whether there will be another rate hike in November. She underscored that the ECB has not discussed rate cuts, only stating that decisions will be data-driven, and the market believes further rate hikes are unlikely due to weak economic data.
[Slowdown in Demand Prompts TSMC to Request Delay in Equipment Delivery from Suppliers]
Media reports on Friday indicated that due to economic conditions and weak demand in the end-market, Taiwan Semiconductor Manufacturing Company (TSMC) has requested major suppliers to postpone the delivery of high-end chip manufacturing equipment. Affected companies include ASML, which manufactures lithography equipment. On that day, semiconductor stocks in Europe and the United States collectively declined. TSMC’s Dutch supplier ASML, BE Semiconductor Industries, and ASMI saw their shares drop by 3.5%, 4.8%, and 6.6%, respectively. The Philadelphia Semiconductor Index fell by approximately 3%, underperforming the broader market. Nvidia also declined by about 3.7%, and TSMC’s U.S. shares hit a four-month low, falling by 2.4%.
[Massive U.S. Auto Industry Strike Affects 9% of North American Car Production, Musk Benefits]
The United Auto Workers (UAW) union initiated a strike against the “Big Three” automakers in Detroit on Friday, September 15th. This is the first time in UAW history that a strike has simultaneously targeted the three major U.S. automakers, making it one of the most significant labor strikes in recent years. However, successful new players in the electric vehicle field, such as Tesla and Rivian, have not formed unions. Regardless of the strike’s outcome, Tesla CEO Musk is already a winner. The “Big Three” will undoubtedly incur higher costs, further enhancing Tesla’s significant cost advantage in the electric vehicle sector. Tesla’s stock price surged by 10% last week.
[Beyond Nvidia, Tesla’s Supercomputer?]
The surge in Tesla’s stock price is also related to Wall Street’s upward revisions of target prices. On Monday, Morgan Stanley raised its target price for Tesla’s stock from $250 to $400, emphasizing the potential of Tesla’s Dojo supercomputer project. Dojo is a supercomputer network capable of integrating data from millions of Tesla vehicles, designed to train artificial intelligence systems for complex tasks, such as assisting Tesla’s driver-assist system Autopilot and advancing the capability of “fully autonomous driving.” As of July this year, Tesla had sold nearly 4.53 million vehicles, each transmitting data back to Tesla to develop autonomous driving features.
Utilizing this backend supercomputer designed for real data learning, combining a vast mobile sensor and camera network with powerful edge computing capabilities represents an unprecedented model. This innovation takes Tesla beyond the realm of traditional automakers.
Morgan Stanley believes that, theoretically, Dojo could bring the company up to $500 billion in long-term value. Morgan Stanley predicts that by 2030, Tesla could generate monthly recurring revenue of $2,160 per vehicle owner, derived from services provided by Dojo, as well as automotive subscription software, vehicle charging services, maintenance, software upgrades, and future content development, among other things.
[Chinese Renminbi Loans and Social Financing Surge in August]
In August, RMB loans increased by 1.36 trillion yuan, and the scale of social financing increased by 3.12 trillion yuan, with year-end social financing growing by 9%. At the same time, broad money supply (M2) increased by 10.6% year-on-year. Both new loans and social financing in August showed significant growth compared to the previous month and the same period last year. This is mainly due to the economic, stock market, and real estate stabilization measures implemented intensively during the month, which boosted market confidence. Financial support for the real economy continued to strengthen, and real demand also rebounded simultaneously.
[Weight Loss Pills — The New AI]
The weight loss pill market is booming. As the market values of two major weight loss pill manufacturers, Novo Nordisk and Eli Lilly, continue to soar, financial blog ZeroHedge boldly claims that “weight loss pills are the new AI.” According to the latest predictions from J.P. Morgan, by 2030, with Novo Nordisk and Eli Lilly dominating the market, annual sales of GLP-1 class drugs will exceed $100 billion.
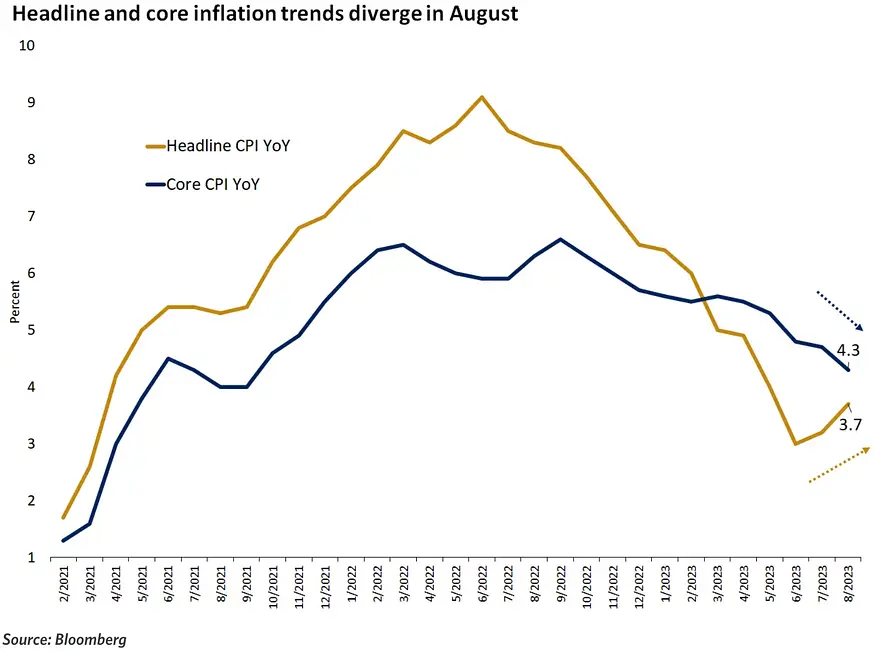
[Stubborn U.S. Inflation — August CPI Soars to 3.7% YoY, Core CPI Accelerates MoM for the First Time in Six Months]
Rising oil prices have led to another acceleration of inflation in the United States in August, potentially requiring the Federal Reserve to maintain high-interest rates for a longer period. Overall, the year-on-year growth rate of the Consumer Price Index (CPI) increased for the second consecutive month, exceeding expectations at 3.6%, compared to 3.2% in July. The month-on-month growth rate of CPI in August accelerated from 0.2% in July to 0.6%, as expected, marking the largest month-on-month increase in 14 months. The Federal Reserve pays more attention to the Core CPI, which excludes energy and food prices. Its year-on-year growth rate declined from 4.7% to 4.3%, as expected, representing the smallest increase in almost two years. However, the month-on-month growth rate of Core CPI slightly rose to 0.3% from July’s 0.2%, surpassing expectations of 0.2%.”
[U.S. August PPI Surges Beyond Expectations, Up 1.6% YoY, Posting the Largest Monthly Gain in Over a Year]
Driven by rising energy prices, the U.S. PPI continued to exceed expectations in August, with a year-on-year growth of 1.6%, higher than the expected 1.3%. This marks the second consecutive month of exceeding expectations. On a month-on-month basis, the PPI increased by 0.7%, reaching its highest growth rate since June of the previous year, with July’s growth rate revised upward to 0.4%. In August, the core PPI increased by 2.2% year-on-year and 0.2% month-on-month, both in line with expectations.
[Gasoline Prices Provide Strong Support, U.S. Retail Sales Soar by 0.6% MoM in August, Far Exceeding Expectations]
Retail sales in the U.S. for August saw a month-on-month increase of 0.6%, surpassing the revised previous figure of 0.5% and far exceeding market expectations of 0.1%. This marks the fifth consecutive month of growth in retail sales. Retail sales in August remained resilient, primarily due to the surge in gasoline prices, with inflationary pressures beginning to manifest in other areas.
Key Point: Concerns About the Inverted Yield Curve
Many investors believe that the current rise in real yields is different from the past, as yields continue to rise despite the central bank’s tightening cycle nearing its end. The market increasingly expects higher equilibrium real interest rates compared to the pre-pandemic decade. This expectation is driven by higher fiscal deficits and productivity growth. With higher fiscal deficits than in the past, there is more government bond supply, and recent technological innovations have led to higher productivity growth, in sharp contrast to the prolonged stagnation during the 2008 financial crisis.
Today, the real yields and real GDP growth in the U.S. appear similar to the period before 2008. In mid-2006, the 10-year government bond priced real yields at around 2.5%. The previous year saw a real GDP growth rate of 3.0%, while the Federal Reserve raised its policy rate target to 5.25%.
Today, the 10-year government bonds offer a real yield close to 2.0%, while the real economy has recently grown by 2.5%. Even today’s target federal funds rate range of 5.25%-5.50% is similar to that of 2006. Market pricing today is almost identical to the situation before the 2008 global financial crisis.
The most significant and closely monitored difference today compared to 2006 is that, both nominally and in real terms, the yield curve is much flatter. In mid-2006, the 2-year government bond nominal yield was the same as the 10-year government bond nominal yield. However, today, the 2-year yield is 70–100 basis points higher than the 10-year yield. Many believe that the severity of the yield curve inversion in 2022 is indicative of a recession in 2023.
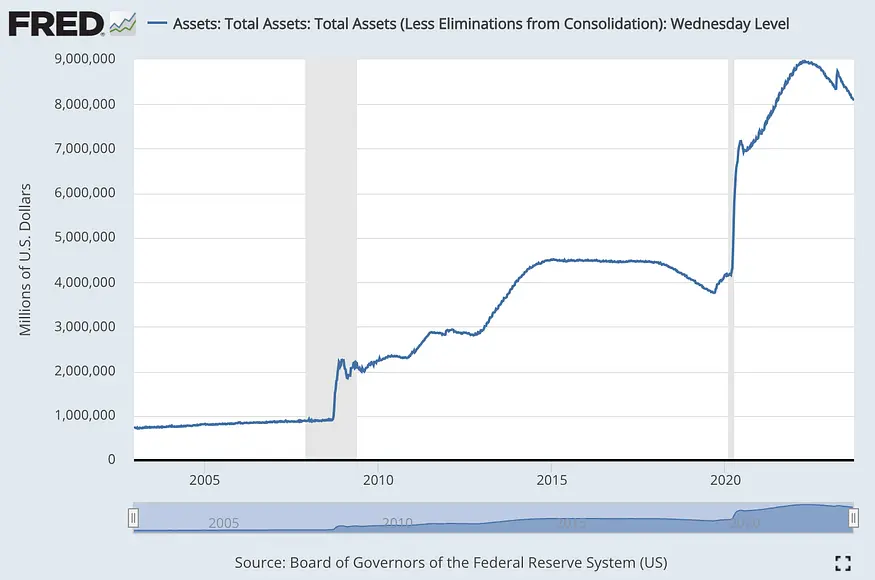
In addition to the market structure distortions caused by the previously mentioned expectations gap, the size of the central bank’s balance sheet may also be a contributing factor. The larger the proportion of long-term government bonds held by the central bank, the flatter the yield curve should theoretically be. Today, the Federal Reserve’s balance sheet size is about an order of magnitude larger than it was in 2006, which means it has expanded by about ten times since then.
Considering the impact of the balance sheet size, today’s real yields may actually be much higher than they were in 2006, and this is an important distinction. In 2006, the Federal Reserve’s balance sheet size was about $800 billion, while today, it is approximately $8 trillion. In other words, today’s balance sheet is about ten times larger than it was in 2006.
Against the backdrop of the Fed continuing to reduce its balance sheet (albeit slowly) and the government’s ongoing issuance of debt, it is difficult to expect a significant decline in bond market yields in the short to medium term unless there is a significant economic slowdown accompanied by rate cuts, a scenario that many people anticipate as a crisis or recession.
Here is an analysis from the pessimistic perspective as of September 17th, by CICC:
Since the Fed began monetary tightening in March 2022, substantial and sustained fiscal expansion has delayed credit tightening significantly, with the post-March SVB event being a typical example of fiscal expansion. However, delayed does not mean absent, and the initiation of credit tightening will act as a ‘gravity’ restricting growth. Since March, the exposure of risk in small and medium-sized banks has simultaneously promoted government credit expansion, accelerating private credit tightening, especially in indirect financing more relevant to small and medium-sized banks: 1) Bank credit standards have clearly tightened, with the proportion of banks tightening commercial real estate, large and medium-sized enterprise, and small business loan standards rapidly increasing, approaching the highest point of the initial stage of the pandemic; credit card and mortgage loan standards have also tightened somewhat. 2) The absolute size of industrial and commercial loans has decreased significantly, with year-on-year growth rates approaching zero, while the growth rates of consumer loans and mortgage loans have fallen from their highs.
Looking ahead, key milestones for the U.S. economic cycle include: the Fed nearing the end of rate hikes by the end of this year, ongoing credit tightening; excess savings will gradually be exhausted early next year, gradually restraining consumption, and inventory clearance will continue until around the second quarter of next year. Therefore, the U.S. economy may continue its downward trend by the end of this year and into next year, but the depth is not expected to be significant (household balance sheets remain healthy). As a result, the market expects the Fed to possibly begin an interest rate-cutting cycle in the second half of next year, at which point the credit cycle will stabilize, triggering a restart of the restocking cycle and a potential economic recovery after hitting bottom.
On the contrary, an analysis from the optimistic perspective by Deutsche Bank:
In its report on September 14th, the bank believes that the U.S. economy is currently in a period of resilient growth, with no clear signs of a recession. This is mainly based on several positive factors:
(1) Both businesses and households have healthy financial conditions, with strong balance sheets. Corporate leverage is low, and households have ample savings. This is different from past economic recession cycles.
(2) The job market remains relatively tight, with unemployment rates nearing historic lows. Companies are reluctant to downsize, and the employment numbers are still below pre-pandemic trends. (As of now, the total employment figures remain slightly below the expected levels of continuous growth at a rate of 1.6% from 2015–2019).
(3) During the pandemic, households accumulated a significant amount of extra savings. Even with optimistic assumptions, these savings are sufficient to support consumption at least until the second half of 2023.
(4) Real estate is the most interest-sensitive segment of the economy, but it accounts for a modest 2.8% of GDP. Furthermore, there are recent signs of stabilization in real estate sales.
(5) Corporate internal cash flows can cover dividends and capital expenditures. There is limited demand for additional debt financing within companies.
While various leading indicators suggest that the economy may be entering a recession, the actual growth rate has only experienced a slight slowdown. The report suggests that the economy may continue to grow at a slow pace rather than entering a recession. The Federal Reserve’s tightening cycle is also nearing its end, making significant tightening less likely. However, the report also anticipates that the Federal Reserve is unlikely to significantly lower interest rates to stimulate the economy in the future.
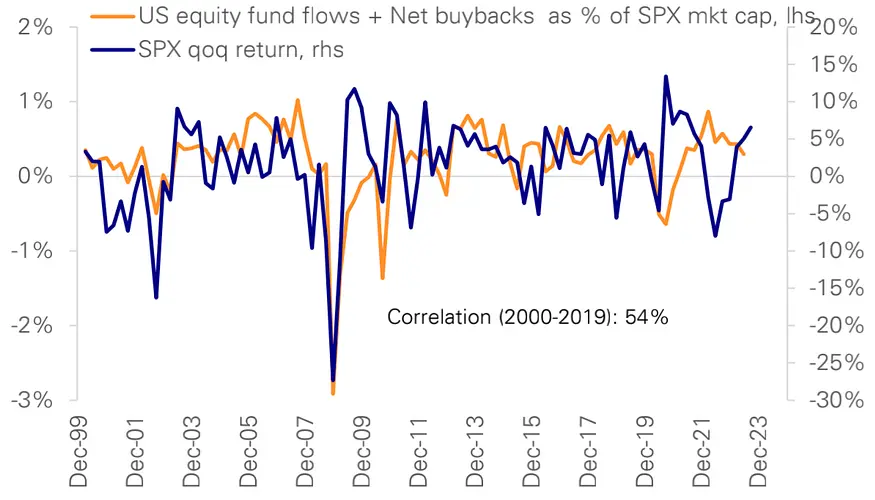
Historically, a combination of liquidity, stock buybacks, issuances, and changes in positions has explained most of the fluctuations in stock market returns. In a relatively mild short-term recession, it is expected that positions will experience modest declines, which will be offset by stock buybacks. The balance of supply and demand should be sufficient to maintain the S&P 500 index at around 4500 points by the end of the year.
Funds and Positions
In summary, overall stock positions saw a slight increase last week, driven by subjective investors’ increased holdings. Stock funds recorded their largest net inflow in 18 months, and bond fund inflows saw a slight uptick, while money market funds continued to see strong inflows.
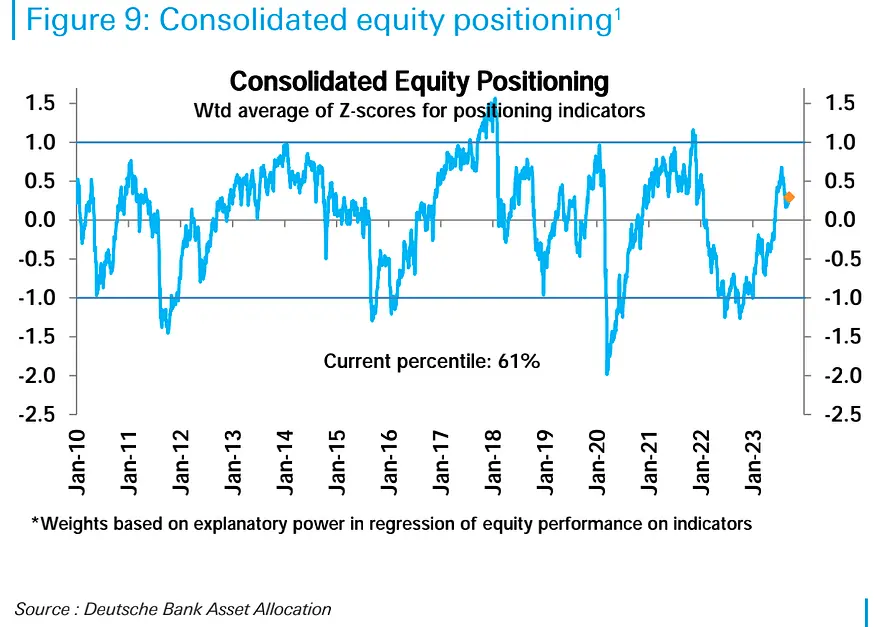
Looking at the market, we are currently in a typical correction phase, with overall stock positions seeing a slight increase this week, slightly above the neutral level (historical percentile of 61%). This increase is primarily due to higher positions held by subjective investors:
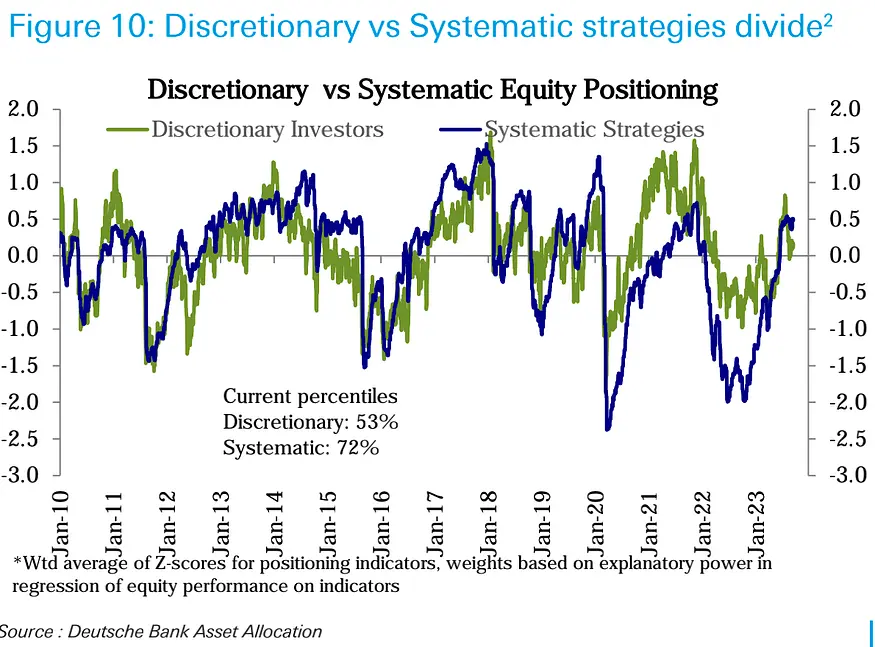
Specifically, subjective investors’ positions rose from the 49th percentile in history to the 53rd percentile, while systematic strategy investors increased from the 71st percentile to the 72nd.
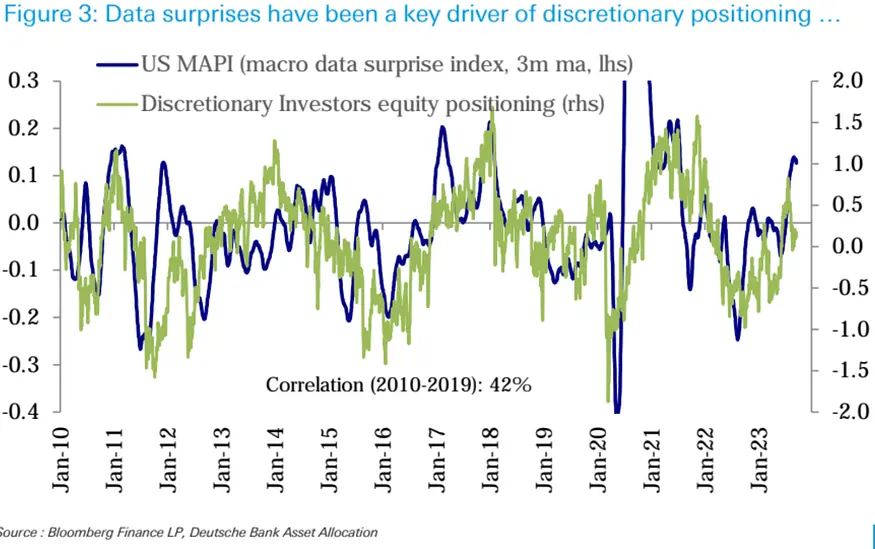
In general, the rebound driven by extreme bearish sentiment has largely completed by August and is no longer the primary driver supporting the stock market. In the current phase, it is necessary to rely on fundamental drivers, such as economic data surpassing expectations and improvements in corporate profits, to stimulate the stock market to establish more bullish positions.
Deutsche Bank’s viewpoint suggests that expectations for surprising economic data remain low. A series of better-than-expected growth data has kept the Economic Surprise Index consistently strong, but the expectation of future economic slowdown remains mainstream. Therefore, this may support the next round of better-than-expected data. Additionally, there is a strong positive correlation between the changes in subjective investor stock positions and the Economic Surprise Index:
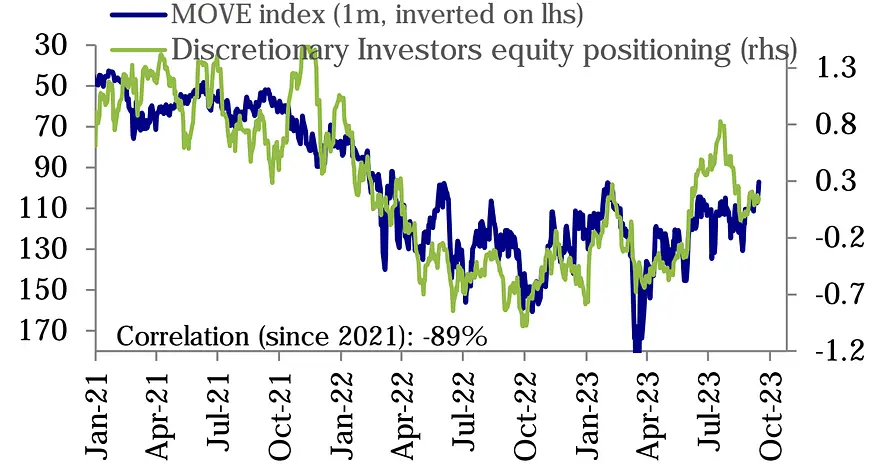
Furthermore, the subjective investors’ positions have consistently shown a high negative correlation with interest rate volatility (the correlation coefficient has been -89% since 2021), as they continue to focus on the lagging effects of monetary policy tightening. Currently, interest rate volatility has reached an 18-month low:
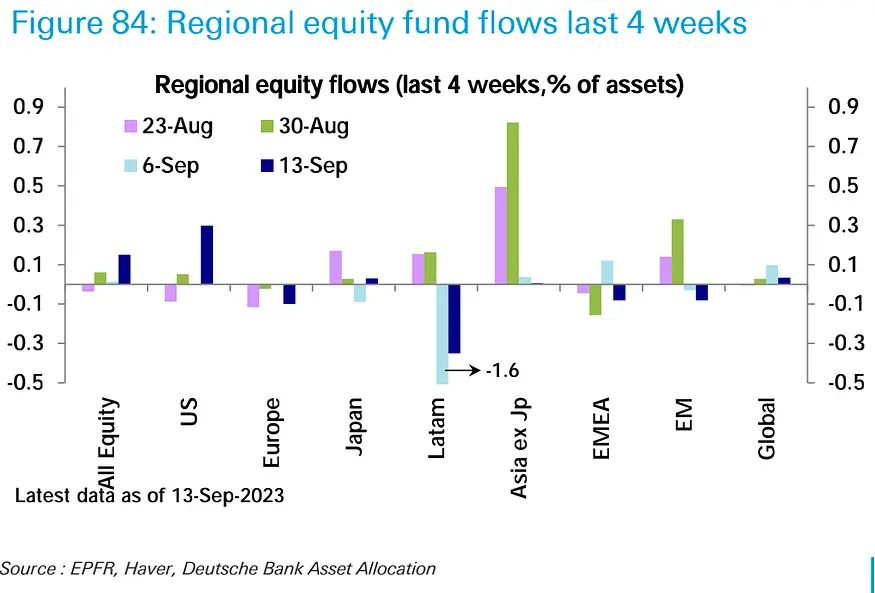
Last week, stock funds (ETFs and mutual funds) recorded the largest weekly net inflow in 18 months ($25.3 billion), primarily from the United States ($26.4 billion). Emerging market funds (-$1.2 billion) saw net outflows for two consecutive weeks, while European funds (-$1.4 billion) extended their net outflows for 27 weeks:
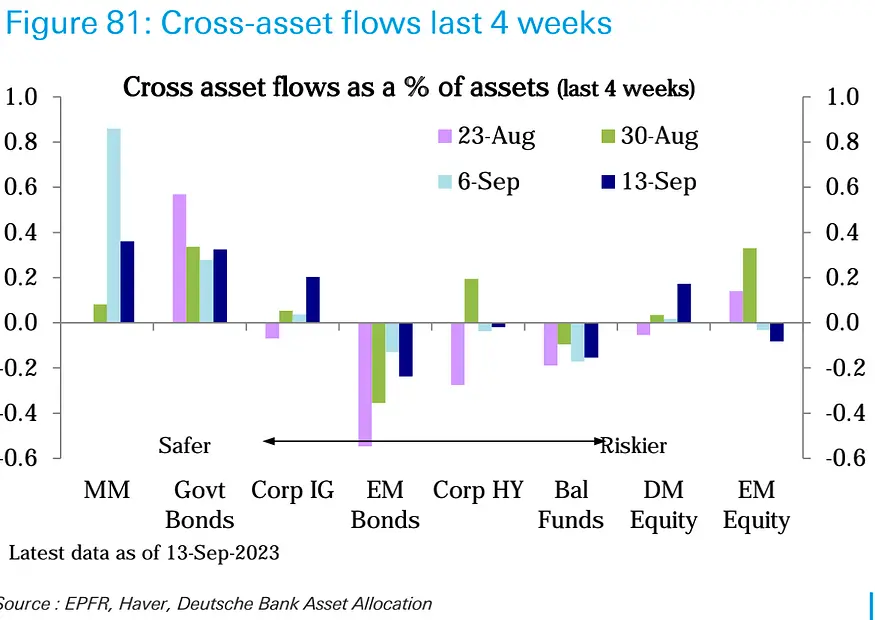
Bond funds ($4.8 billion) saw slightly higher inflows compared to the previous week. Investment-grade corporate bonds ($2.0 billion) saw accelerated inflows, but high-yield bonds (-$1.0 billion) and emerging market bonds (-$1.1 billion) continued to experience net outflows. Government bonds ($3.0 billion) continued to see inflows.
Money market funds saw inflows of $28.9 billion, which were slightly lower than the previous week but remained strong, primarily in the United States ($23.2 billion).
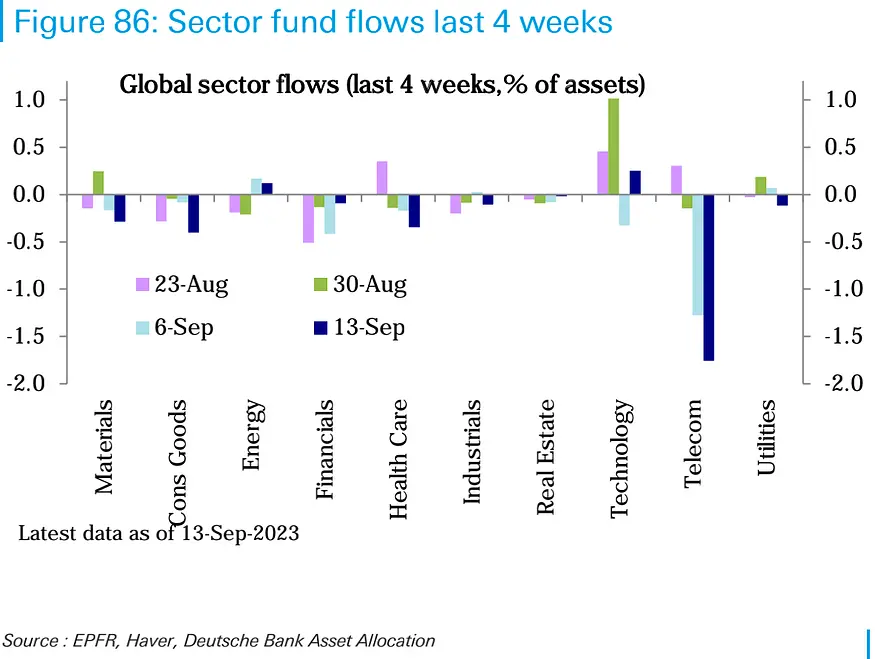
Looking at sectors, the technology sector ($1.3 billion) shifted to inflows after net outflows the previous week. The energy sector ($200 million) also saw moderate inflows. The healthcare (-$800 million), non-essential consumer goods (-$600 million), telecommunications (-$400 million), raw materials (-$300 million), and financial (-$200 million) sectors experienced net outflows, while flows in other sectors were relatively small.
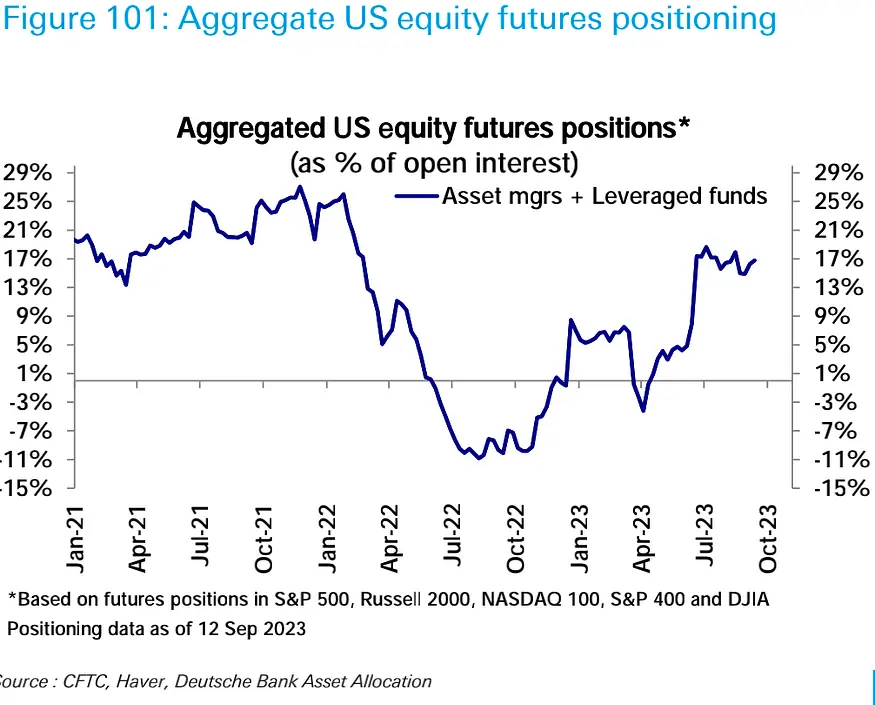
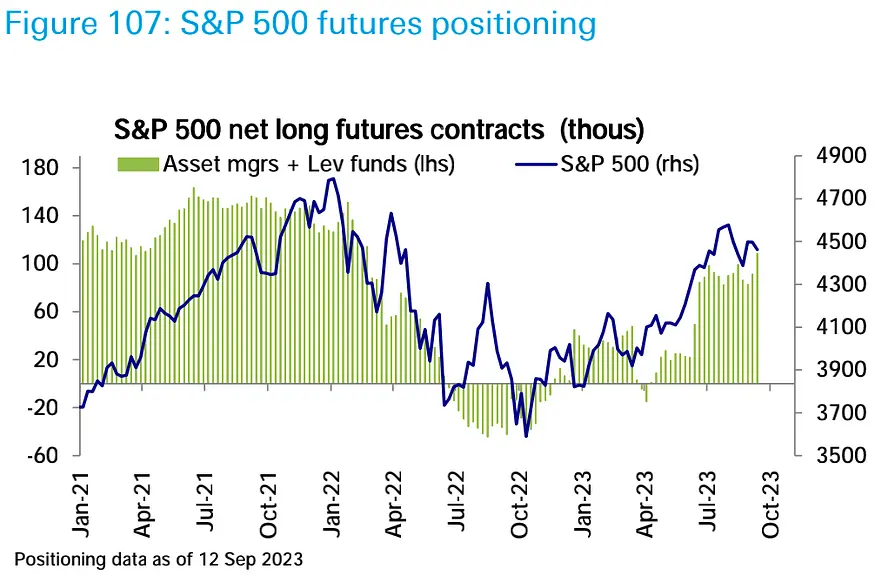
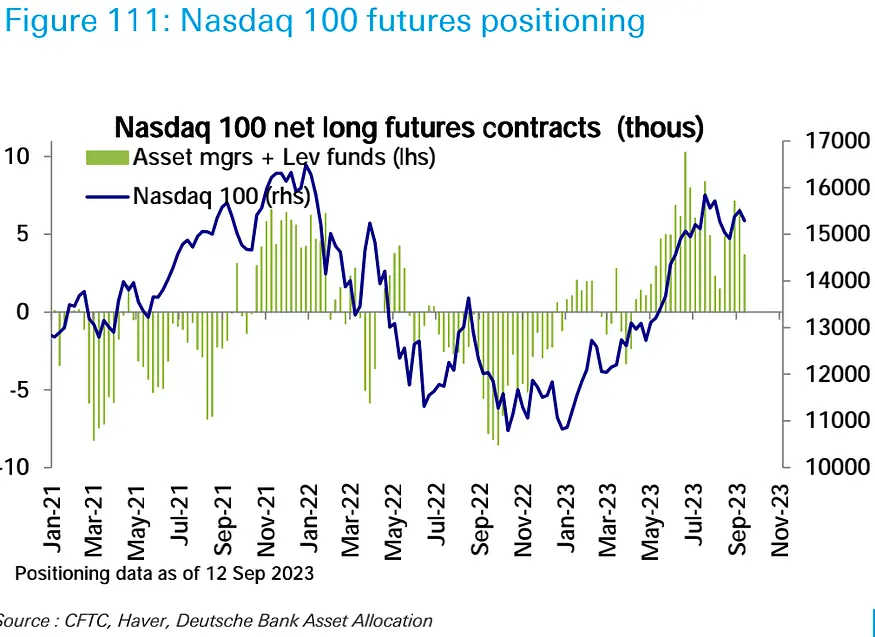
In the futures market, U.S. stock futures remained generally stable, with net long positions in S&P 500 futures increasing to their highest level since February of last year, while net long positions in Nasdaq 100 futures decreased:
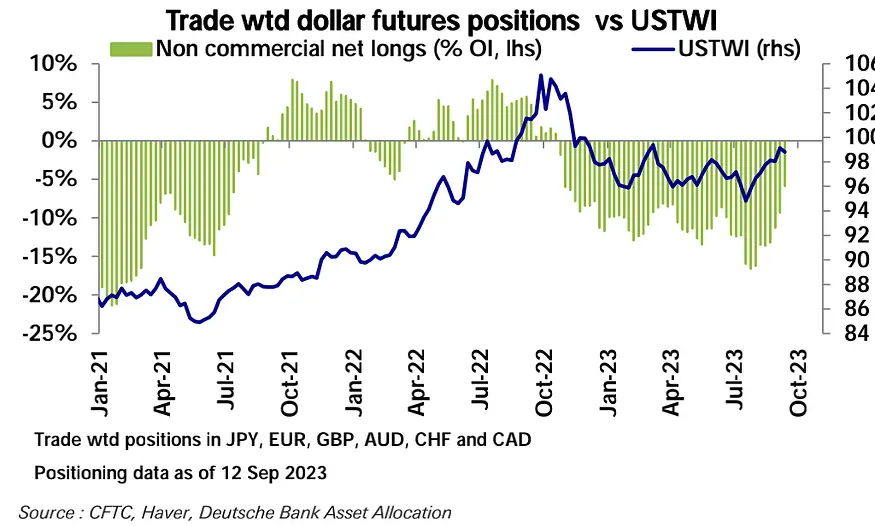
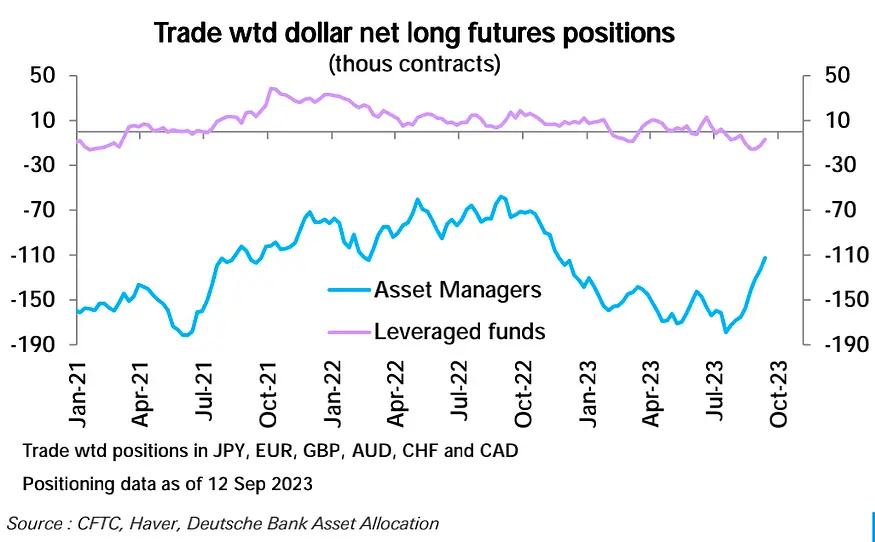
Net short positions in the U.S. dollar have decreased for the fourth consecutive week, reaching their lowest level since October of last year, primarily driven by reductions in net short positions by large asset managers:
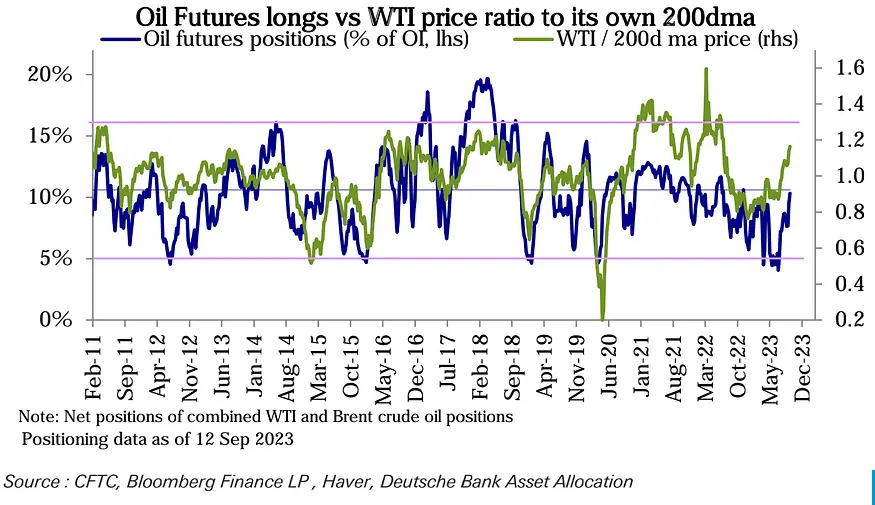
In the commodities market, net long positions in crude oil have reached their highest level since October of last year:
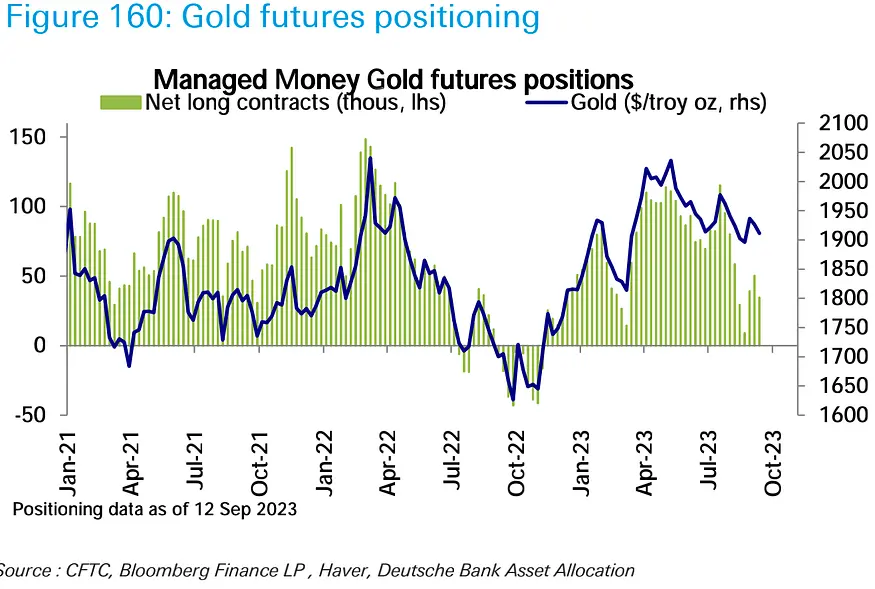
However, net long positions in gold have decreased:
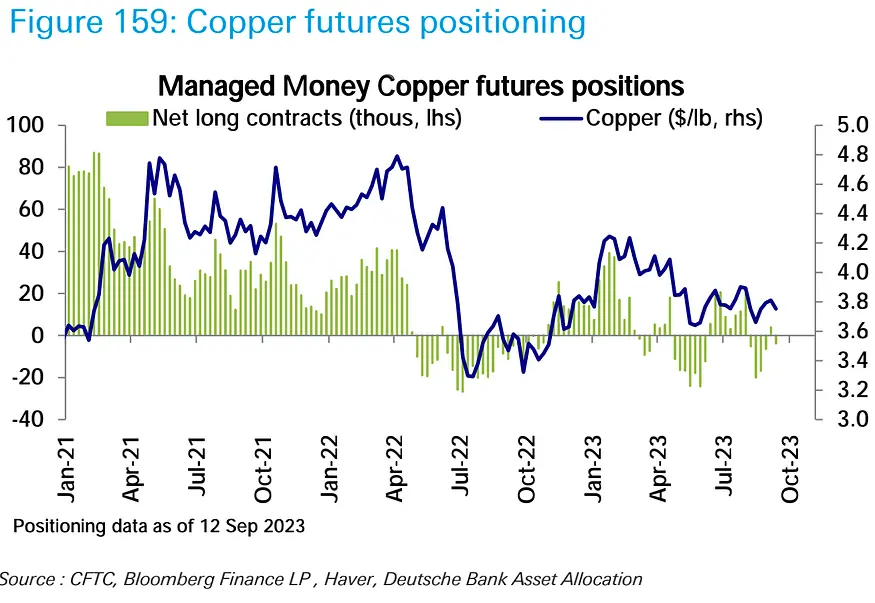
Copper positions have flipped from net long to net short:
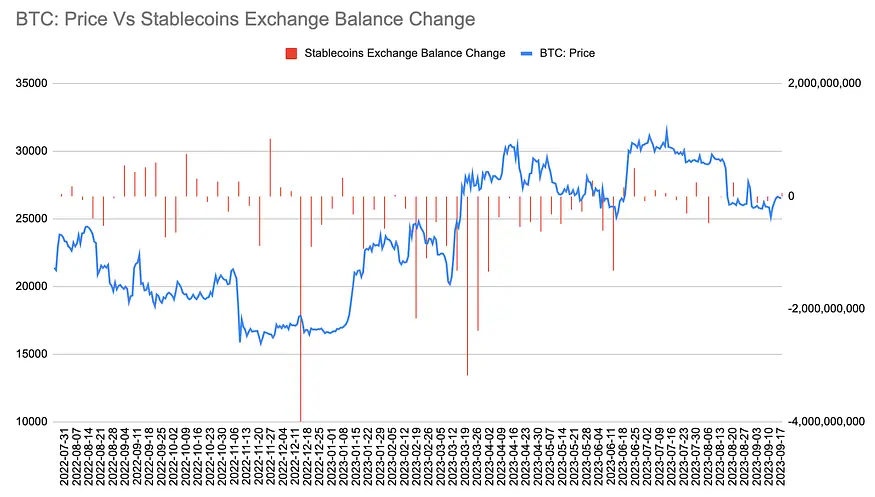
Regarding cryptocurrencies, centralized exchanges saw a small net inflow of $57 million in stablecoins over the past seven days, bringing the total to $13.86 billion:
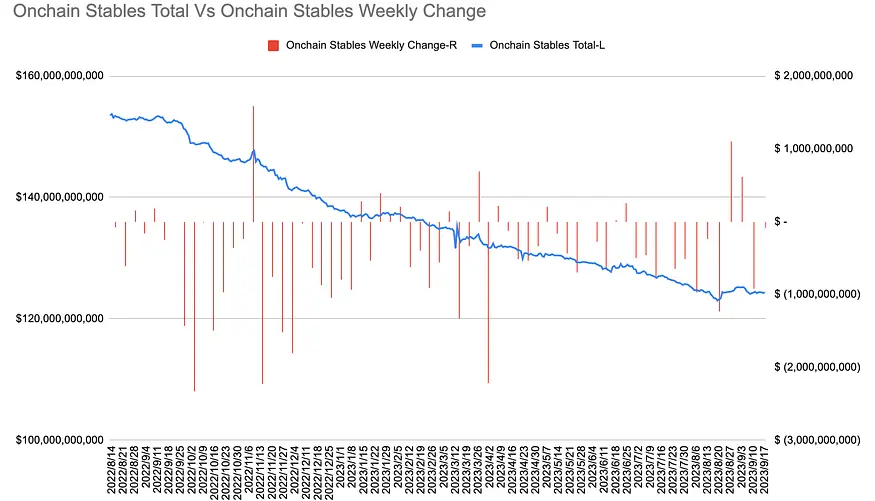
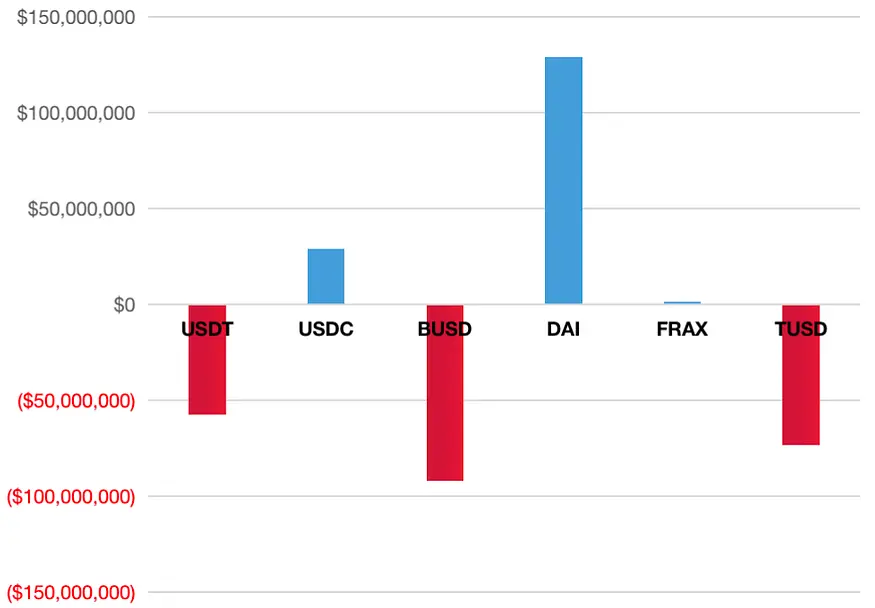
On-chain stablecoins saw a net outflow of $92 million, reducing the total to $124.3 billion, with contributions to the outflow primarily coming from BUSD, USDT, and TUSD, while DAI and USDC primarily contributed to the inflow:
Investor Sentiment
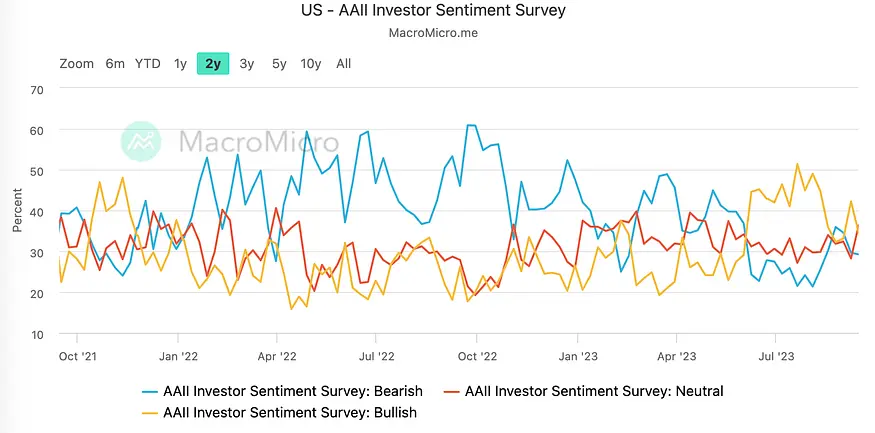
Last week, the proportion of neutral views in the AAII survey rose to 36%, bullish sentiment declined to 34%, and bearish sentiment remained unchanged:
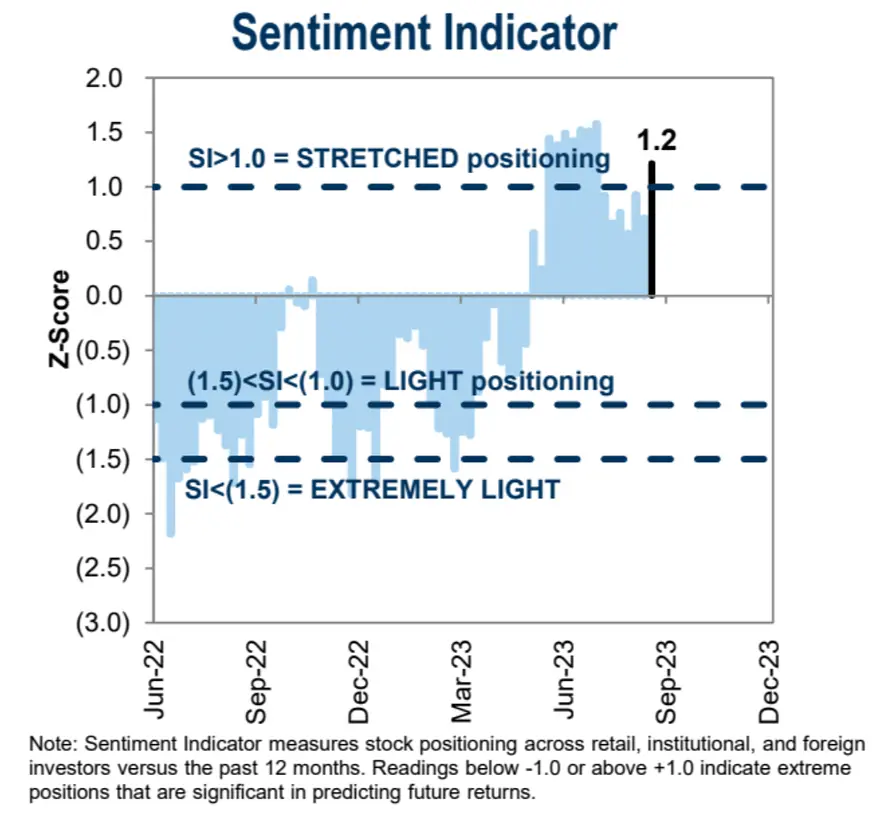
Goldman Sachs’ Institutional Sentiment Index saw a significant jump, reaching 1.2, indicating a stretched position:
Focus for the Week
This week is a super week for central banks, with the United States (unchanged), the United Kingdom (expected +25bp), Switzerland (expected +25bp), and Japan (unchanged) central banks all in action. The main focus will be on Wednesday’s Federal Open Market Committee (FOMC) meeting. The market generally expects the Federal Reserve to maintain interest rates steady after the rate hike in July but will emphasize in its forecasts and communication that further tightening remains possible this year. Data this week is limited, mainly centered around housing, and is unlikely to have a significant impact on the Federal Reserve’s meeting.
The meeting statement may show mixed progress on the conditions for pausing further rate hikes, including moderate economic growth, signs of improved inflation, but still a tight labor market.
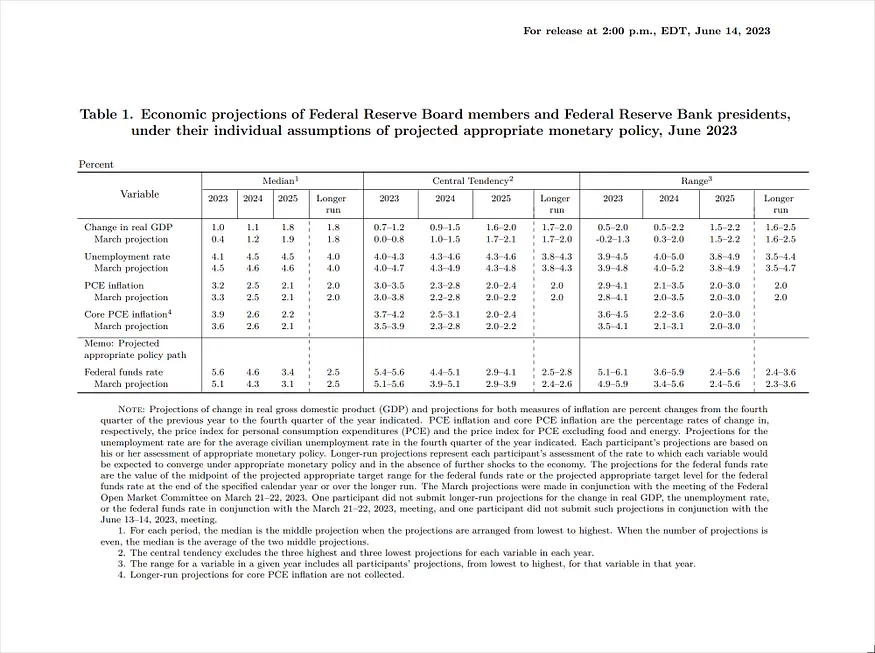
The economic forecast summary may indicate upward revisions in growth forecasts, especially for 2023, while inflation forecasts may see slight downward adjustments, considering that the PCE figures have already reached 3.2%, as expected in June. Regarding interest rates, the Fed’s Summary of Economic Projections (SEP) in June showed a final peak federal funds rate of 5.6% in 2023, expected to decrease to 4.6% in 2024, and further to 3.4% in 2025, with a long-term rate of 2.5%. Given recent data developments, the 5.6% forecast for 2023 seems likely to remain unchanged or be slightly lowered, while median rates for 2024 and 2025 may remain steady or slightly rise.
Although the long-term rate remained at 2.5% after the June meeting, the central tendency shifted from 2.4%-2.6% to 2.5%-2.8%. This suggests that the Federal Reserve may consider the neutral interest rate (neither stimulating nor restraining economic activity) to be higher than before, with a 2% inflation target implying a real interest rate of 0.5%.
In the bond market, the 30-year Treasury yield is approximately 4.2%, resulting in a real rate of 2.2% after subtracting the Fed’s 2% inflation target, well above the Fed’s expectations. Therefore, the bond market appears relatively aggressive in pricing, while on the equity side, declining earnings yields and rising price-earnings ratios indicate that the stock market still does not believe that the Fed must maintain restrictive interest rates for an extended period.
In the interest rate derivatives market, the short-term path aligns closely with the Federal Reserve, with the highest policy rate at 5.45%, expected to decrease to around 4.6% by the end of 2024, as per the June SEP forecast:
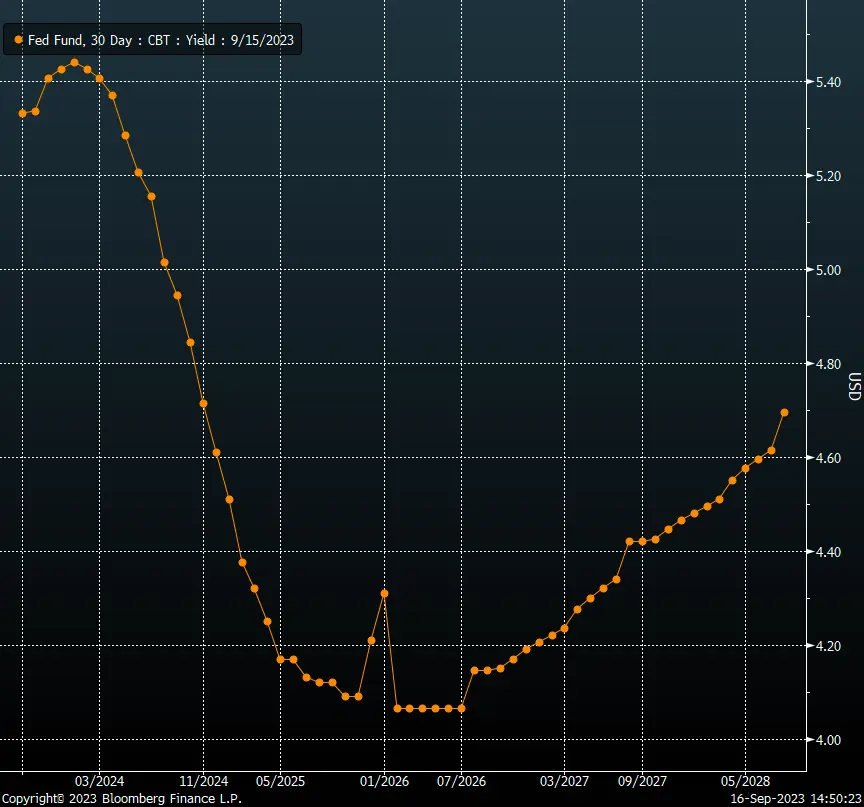
However, the long-term path differs significantly, with the futures market projecting a “U” shaped rate path, expecting nominal rates to rebound quickly to 4.7% after hitting bottom in 2026, then decreasing to around 4.1% by 2026, and continuing to rise thereafter. This indicates a significant discrepancy of over 100bp in long-term expectations compared to the Fed’s 3.4% forecast for 2025, with an even greater gap of over 200bp in long-term expectations.
Who would you trust? Those who believe the Fed is wrong can take a bearish stance on risk assets, while those who think interest rate futures traders are mistaken can take a bullish stance.
In terms of the press conference, Powell is likely to emphasize the policy’s dependence on data, maintain a cautious stance on declaring victory over inflation, but may acknowledge some preliminary progress in labor market balance. He is unlikely to explicitly state the timing of further rate hikes.
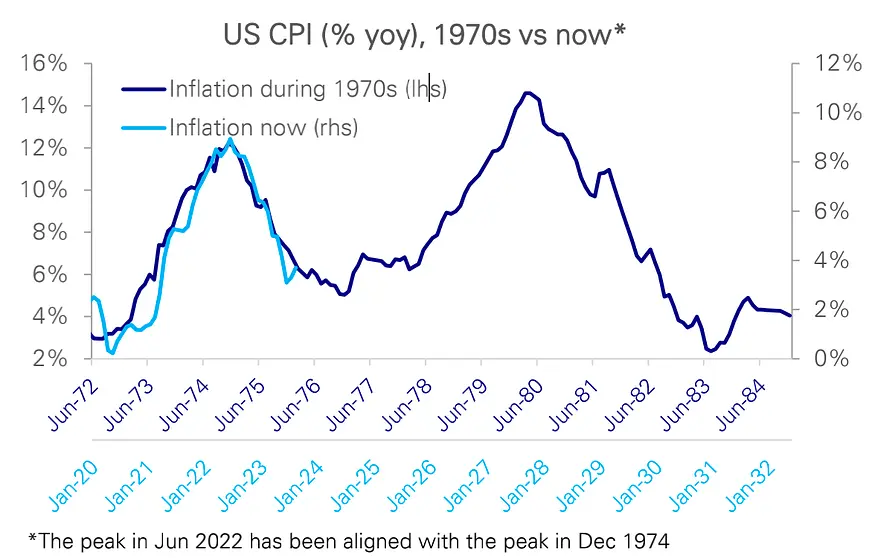
Why do officials remain cautious? The second-round rebound of inflation has been a concern for older officials who have experienced the 1970s, and younger individuals who have not lived through that historical backdrop may not fully appreciate it. This historical context limits the potential scope of any rate cuts:
Certainly, attempting to predict the future for the next month is already very challenging, let alone two or three years ahead. However, the key point is that there is a divergence in expectations between the stock market and the bond market regarding future interest rate trends. The stock market appears to be betting that the Federal Reserve will cut rates multiple times in the future, while the bond market’s expectations differ. As the Fed updates its information next week, the most crucial point to watch is whether there will be any changes in the widely anticipated significant rate cuts in the coming years. Whether it’s the bond market being pulled back or the stock market being pulled back, this is the central struggle in the market.
LD Capital is a leading crypto fund who is active in primary and secondary markets, whose sub-funds include dedicated eco fund, FoF, hedge fund and Meta Fund.
LD Capital has a professional global team with deep industrial resources, and focus on develivering superior post-investment services to enhance project value growth, and specializes in long-term value and ecosystem investment.
LD Capital has successively discovered and invested more than 300 companies in Infra/Protocol/Dapp/Privacy/Metaverse/Layer2/DeFi/DAO/GameFi fields since 2016.
Disclaimer
I confirm that I have read and understood the following: The information contained in this article is strictly the opinions of the author(s). This article was authored free from any form of coercion or undue influence. The content represents the author's own views and does not represent the official position or opinions of CrossAngle. This article is intended for informational purposes only and should not be construed as investment advice or solicitation. Unless otherwise specified, all users are solely responsible and liable for their own decisions about investments, investment strategies, or the use of products or services. Investment decisions should be made based on the user’s personal investment objectives, circumstances, and financial situation. Please consult a professional financial advisor for more information and guidance. Past returns or projections do not guarantee future results.
Xangle or its affiliated partners own all copyrights of the written or otherwise produced materials and content provided on the platform. Any illegal reproduction of such content, including, but not limited to, unauthorized editing, copying, reprinting, or redistribution will result in immediate legal actions without prior notice.