Beneath the Surface of Uniswap V3 Pools: Just-in-Time Liquidity Revisited

Written by Riyad Carey, Kaiko

Imagine there is $1,000 of liquidity concentrated in a $0.01 price range. As a liquidity provider (LP), I see that someone has submitted a swap of $100 worth of token x for token y, which will incur a fee of $1. Within the same block, I add $9,000 of liquidity ($4,500 of each token) in that small range, which now represents 90% of liquidity in the range. This means I will receive 90% of the $1 fee, leaving the passive LPs with just 10 cents compared to my 90 cents. I then remove my deposited liquidity, albeit with a slightly different token makeup; now I have $4,501 of token x and $4,499 of token y (this breakdown depends on how much price moved), plus fees earned, less gas fees and MEV cost.
Below is how it looks in practice, showing a few hours of liquidity events in the largest Uniswap V3 wETH-USDC pool:

JIT transactions are colored in orange, while regular transactions are in blue. The crosshairs represent a mint and burn of the same USD value in the same block. It’s immediately clear that JIT transactions are significantly larger than regular transactions, generally with a minimum size of $10mn. Note the small orange dot just a bit after 3pm; this was an unusual JIT transaction because it is both much smaller and uses a wider price range (2 ticks instead of 1), allowing for more impermanent loss. Having looked at some of these smaller transactions, it appears that many of them are tests of new JIT strategies.
IMPERMANENT LOSS
Despite JIT transactions necessarily occurring in a single block, they are still subject to impermanent loss, albeit on a much shorter timeframe than we’re used to. An interesting pattern also emerges when looking at how the wallets are conducting transactions; all of the top wallets have opted to use strategies that prioritize ending a transaction with more ETH at the expense of USDC.
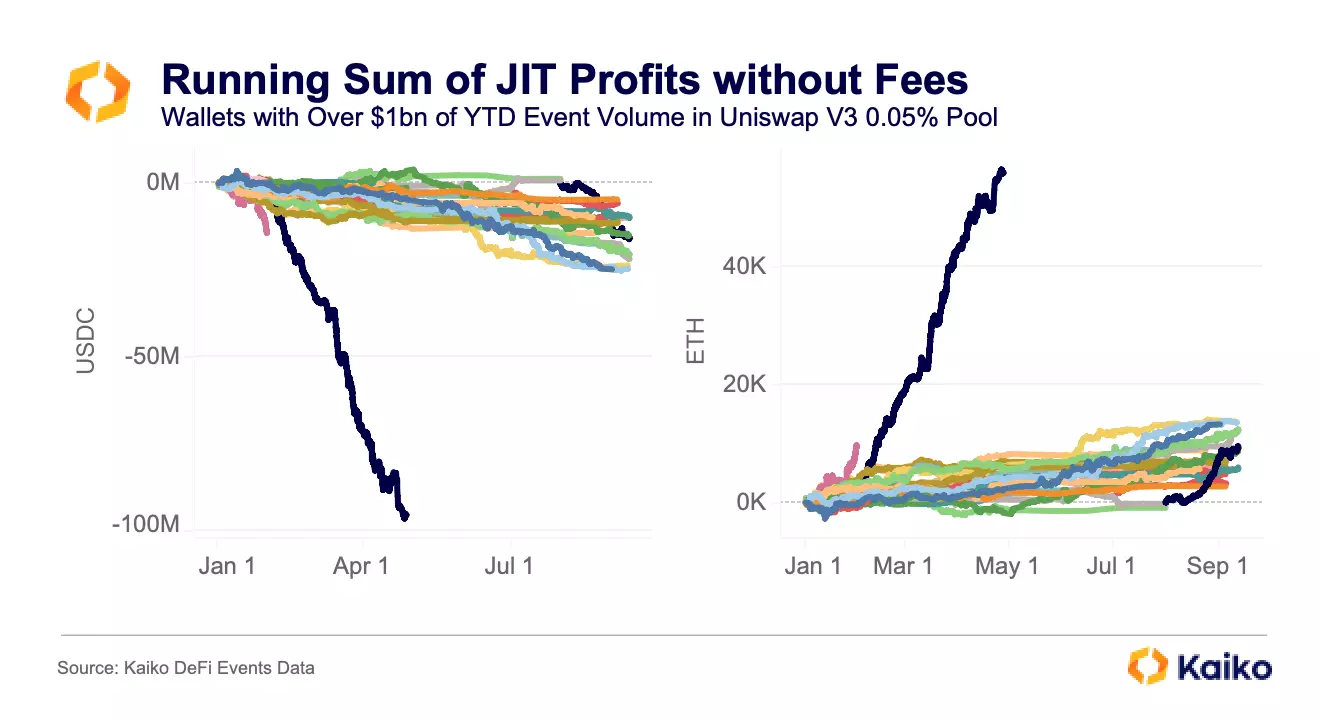
The top wallet – which I’ll detail more in the next section – net 50k ETH and lost 100mn USDC in the span of five months, not including the swap fees it earned. Essentially, JIT LPs strongly prefer to receive more of the volatile asset at the expense of the stable asset, meaning they also prefer to operate in blocks where ETH’s price is decreasing; as ETH’s price falls LPs receive relatively more ETH and less USDC.
Using this we can estimate the wallet’s non-fee profits by taking the difference between the amount a wallet mints and burns (for example, minting 100 USDC and 0.1 ETH and burning 90 USDC and 0.11 ETH, netting -10 USDC and 0.01 ETH) and then applying cross prices to the returns. Below is the distribution of JIT transactions in the main Uniswap V3 wETH-USDC pool by quarter.
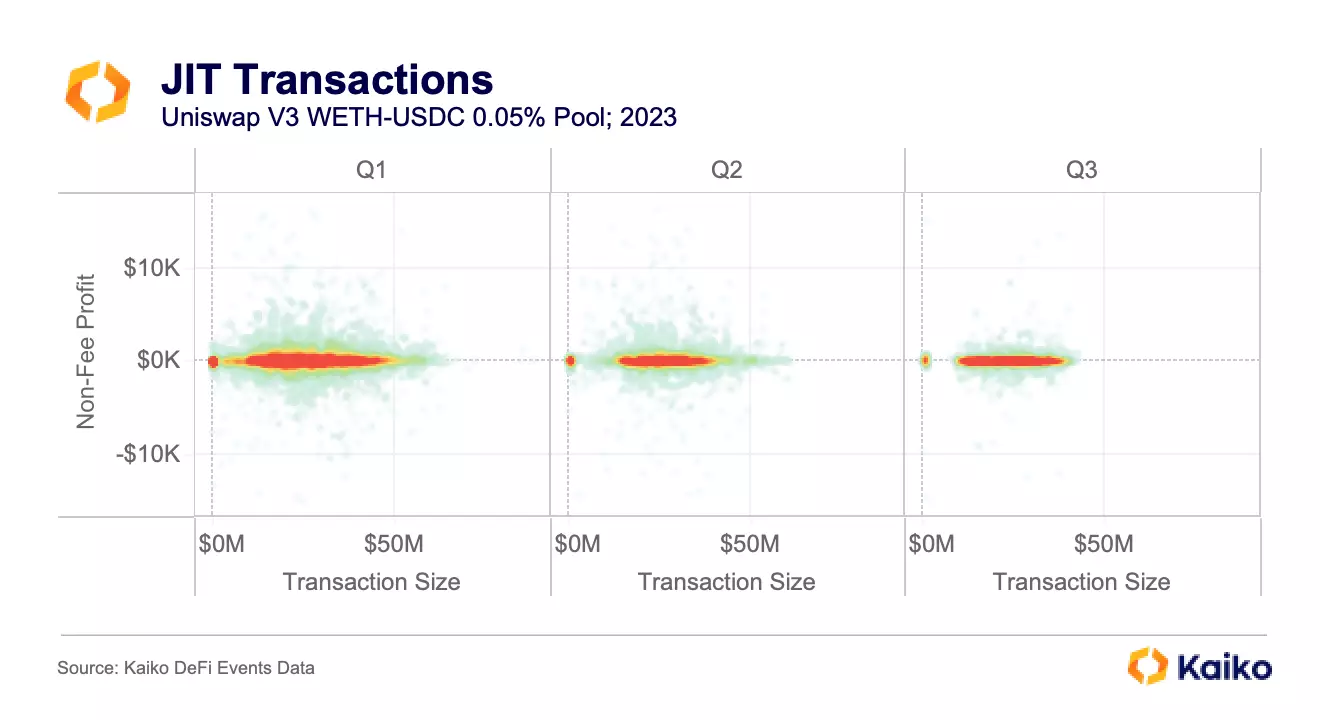
The vast majority of JIT transactions are clustered between $20mn and $40mn, earning very minimal non-fee profits; it’s quite rare for a JIT transaction to profit more than $5k. However, as another paper found, for JIT LPs these “portfolio change” profits contribute more to JIT LP income than fees do. Note that the small JIT transactions are also visible and have been present in each quarter.
Thus JIT LPs are only able to effectively manage risk and operate in pools that contain a stablecoin like USDC. I had assumed that JIT LPs would be extremely active during USDC’s depeg, one of the highest volume days of the year with plenty of opportunities to earn swap fees. Instead, it was the one of lowest JIT volume days of the year at under $75mn, compared to $3.5bn just the day before. It was also one of the few days of the year when non-JIT volume was higher than JIT volume as regular LPs rushed to cut their exposure to USDC.
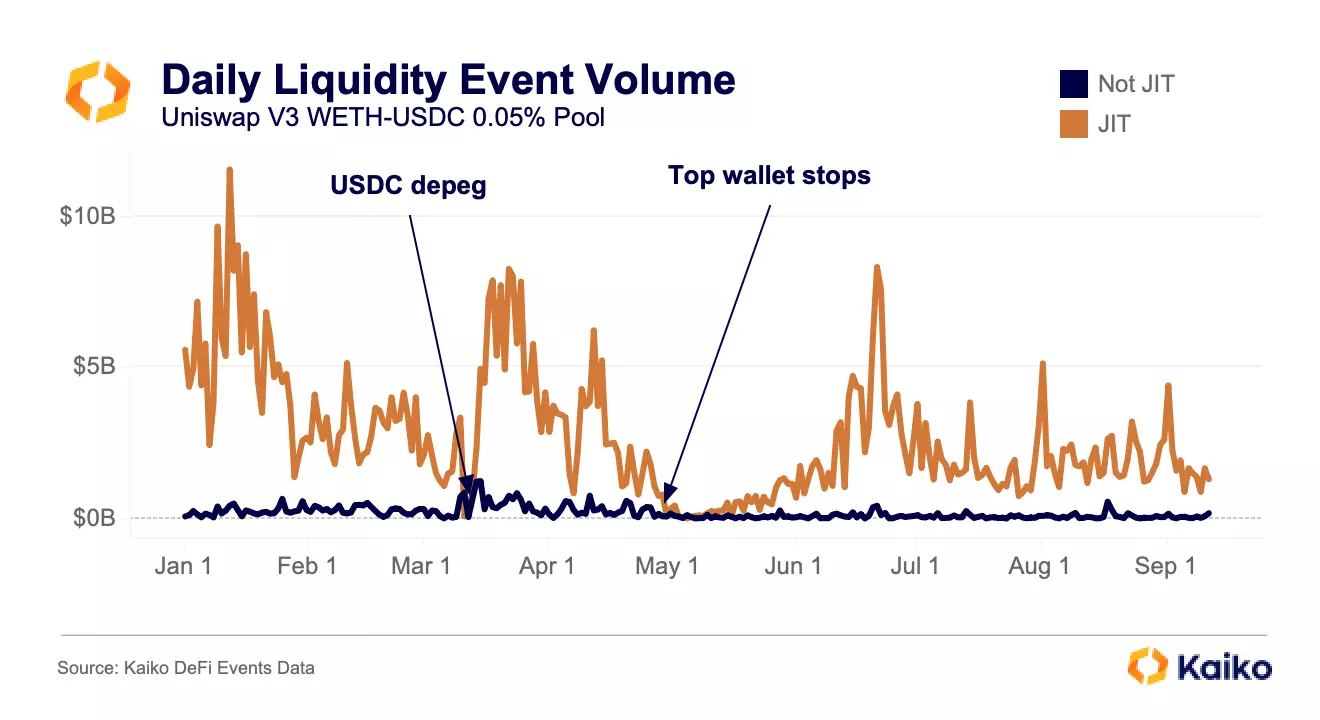
As USDC fell below $0.90, JIT LPs stepped to the sidelines because they were no longer able to effectively manage their portfolio changes.
PARTICIPANTS
The other striking takeaway from this chart above is how sharply total JIT volume fell when the top wallet exited the market; on May 5, just a few days after its departure, there was just $600k JIT volume. It took more than two months for daily JIT volume to break the $2bn level again. This wallet did $100bn in event volume and was only active from January to the end of April
Given the high capital requirements and low ROI, the market has few participants and is dominated by even fewer. This year, the top 25 wallets have accounted for $740bn of the $760bn in liquidity event volume in Uniswap V3 wETH-USDC pools, nearly all of which has been in the 0.05% fee pool [1]. The top five accounted for nearly $300bn.

Below is the running sum of liquidity event volume from May 1 onwards, showing that for nearly a month there was relatively little activity before a few different wallets started to surge in June.
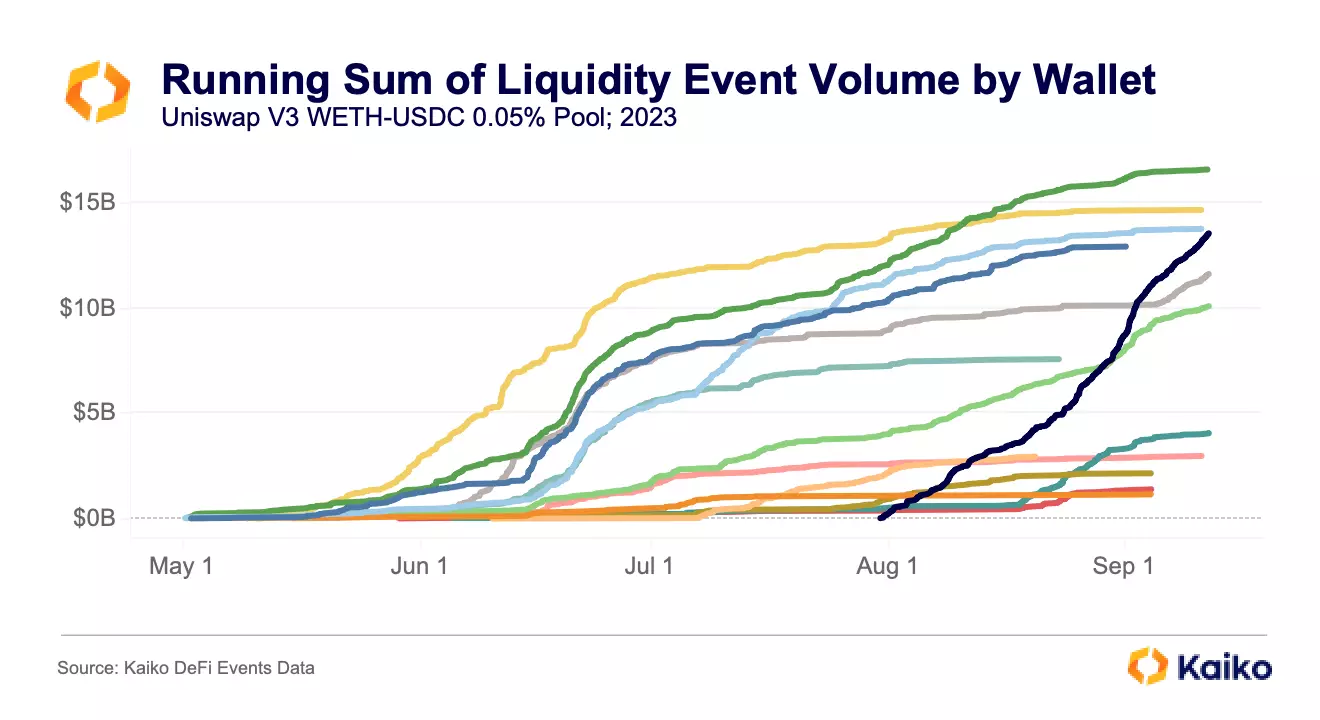
These wallets began to tail off in July only to be replaced by a new wallet that has done $15bn of volume in just three months, though this is still a far cry away from 0xdd’s $100bn in five months. It’s possible, maybe even likely given the timing, that these wallets are controlled by a single person or entity.
CONCLUSION
JIT is complicated, dependent on market conditions, and extremely capital intensive with low ROI. Because of this, it makes sense that there are few JIT LPs and even fewer that operate on a scale to make serious profits; it is also significantly less profitable than some more nefarious MEV strategies like sandwich attacks. Because of this, the JIT market is constantly in flux, totally unseen to the average DeFi user. However, even though JIT is unseen to most, it has important implications for all Uniswap LPs, as JIT LPs siphon away swap fees from static participants, as well as to large traders, for whom JIT LPs provide superior execution.
[1] JIT LPs favor this pool for three main reasons: it is consistently one of the highest volume pools in DeFi, it is very liquid, and there is only one volatile asset (as opposed to a pool like wBTC-wETH, for example).
Original Link
Disclaimer
I confirm that I have read and understood the following: The information contained in this article is strictly the opinions of the author(s). This article was authored free from any form of coercion or undue influence. The content represents the author's own views and does not represent the official position or opinions of CrossAngle. This article is intended for informational purposes only and should not be construed as investment advice or solicitation. Unless otherwise specified, all users are solely responsible and liable for their own decisions about investments, investment strategies, or the use of products or services. Investment decisions should be made based on the user’s personal investment objectives, circumstances, and financial situation. Please consult a professional financial advisor for more information and guidance. Past returns or projections do not guarantee future results.
Xangle or its affiliated partners own all copyrights of the written or otherwise produced materials and content provided on the platform. Any illegal reproduction of such content, including, but not limited to, unauthorized editing, copying, reprinting, or redistribution will result in immediate legal actions without prior notice.