Comparing the Supply-Demand Relationship of LDO and RPL Tokens

Written by Yuuki, LD Capital
With the current Ethereum staking rate exceeding 20% and still maintaining a good growth rate, the fundamental market of the LSD (Liquid Stake Derivatives) field and different underlying assets has been detailed in previous reports. This article aims to analyze from a capital perspective the sell-off pressure and demand brought by non-secondary market transactions of the top two LSD assets, Lido and RocketPool, to provide a reference for selecting underlying assets for different investment periods. (FXS, due to its diversified product positioning, cannot be simply attributed to the LSD field and has a deviation from the fundamentals of LDO and RPL, hence it is not included in the discussion for the time being.)
1. LDO token distribution and sell-off sources:
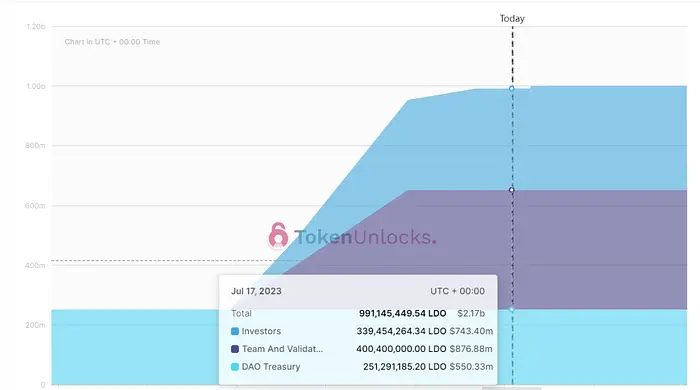
LDO has a total issuance of 1 billion, with a current circulation of 879 million. In the token distribution, 40.2% belongs to the team and validators, 34.6% to investors, and 25.2% to the treasury (current data statistics come from Tokenunlocks and not the initial token distribution). The next major unlock of LDO tokens will take place on August 26, 2023, with an unlocking share of 8.5 million LDOs, belonging to Dragonfly, with a token cost of $2.43. The following is the distribution and unlock status of LDO:
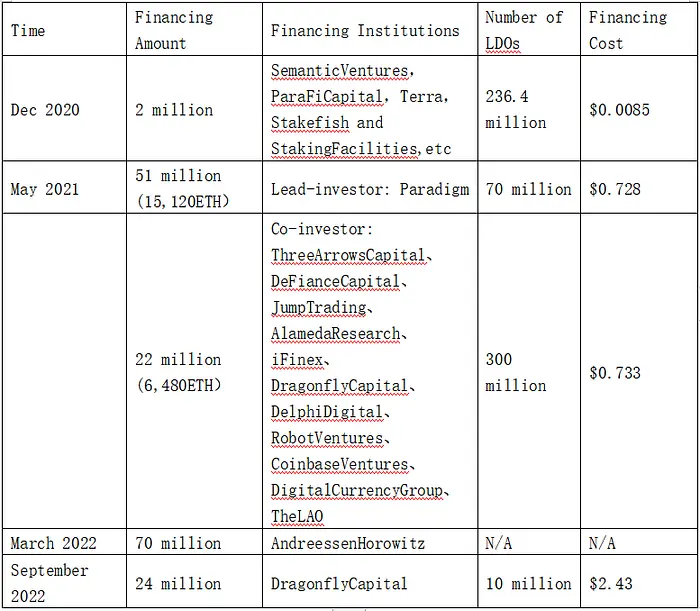
Lido has had a total of 5 financing rounds, the first of which took place before the token issuance, with extremely low financing costs ($0.0085 per LDO).
The main issue affecting the secondary market price of LDO is that most of the primary market investors have completed the unlocking, and continuous profit sell-off has brought great pressure to the secondary market. Due to the extremely low financing costs in the first round, with an average cost of about $0.0085, which is more than 200 times the current price, it is necessary to pay close attention. The table below shows the distribution of the first round of investor tokens, related addresses, and current token balance:
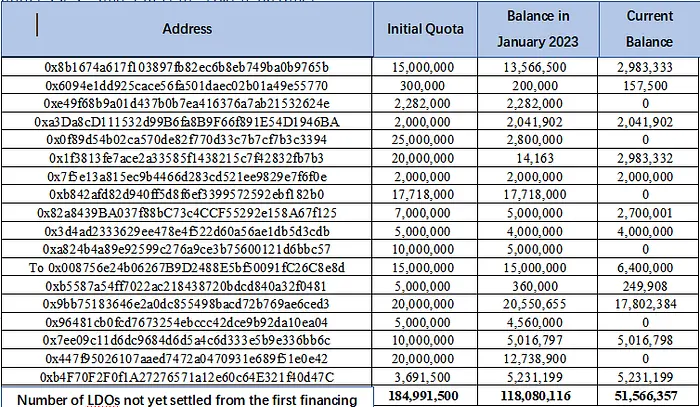
The table above includes over 90% of the first round investor addresses. The aggregated data shows these low-cost investors are continuously selling tokens. The tokens of the first-round investors began to unlock linearly from December 2021 and were fully unlocked by December 2022. Due to their extremely low cost, they are relatively insensitive to the current secondary market price. From the initial amount, the January 2023 balance, and the current balance, the first-round investors sell approximately 7.41 million LDOs linearly each month. Currently, the total amount of unsold tokens from the first financing round is 51.57 million, and at the above selling rate, the sell-off will continue for 7 months.
From this perspective, in the absence of significant changes in Lido’s fundamentals and lack of incremental capital in the market, LDO’s secondary market price performance will continue to be suppressed until the shares of primary market investors are cleared. (Recently, due to the XRP victory in the SEC lawsuit, the market has lowered its expectations of the impact of SEC regulation on Ethereum staking. LDO prices have risen sharply along with the prices of “securities concept” tokens like XRP, SOL, ADA. Primary market investor Certus One sold 4 million LDOs at a high price, and the current LDO price has fallen 16.3% from the previous day’s high.)
2. RPL Token Distribution and Supply-Demand Relationship
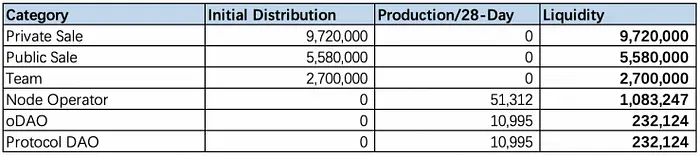
RPL is currently fully circulating with a total volume of 19.55 million. The initial RPL supply was 18 million, of which 9.72 million came from private fundraising (accounting for 54%), with a single token price of $0.21. The public sale accounted for 5.58 million (31%), with a single token price of $0.98. The team owned 2.7 million (15%). The RPL token public sale was completed in January 2018. Given the time elapsed and the market going through bull and bear cycles, the primary market shares have been fully transferred. Looking at the on-chain holding addresses, there is currently no sell-off pressure from primary market investors in RPL, and it’s important to pay attention to the inflation caused by the token issuance. The following is the distribution and inflation of RPL:
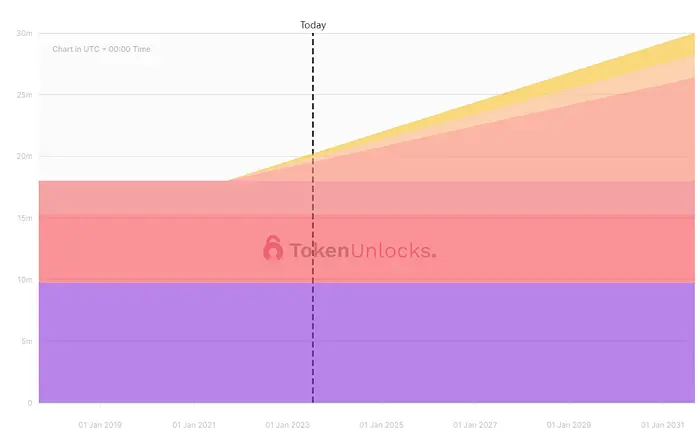
Starting from October 2021, RPL began to inflate linearly at a speed of 73,302 tokens every 28 days, which will continue for 10 years, with an annual inflation rate of 5%. Ultimately, the total volume of RPL will reach 30 million. 15% of the inflation part is allocated to oDAO (Oracle Node DAO), 15% to the protocol DAO, and the remaining 70% to node operators, as detailed below:
In RPL’s emission, node operators account for 70% of the RPL token inflation ratio. Receiving RPL emissions requires operators to stake RPL, with a staking ratio of 10%-150% of the ETH value called by their users. The more RPL is staked, the more RPL emissions are obtained. Most large node operators stake at the maximum rate. The current RPL staking rate is 46.97% and continues to rise. From this perspective, RPL is somewhat like a lever on the ETH value staked on the platform. As the platform’s ETH staking volume increases or the price of ETH rises, the price of RPL will have strong support due to the platform’s staking mechanism. The following graph shows the rise in RPL’s staking rate:
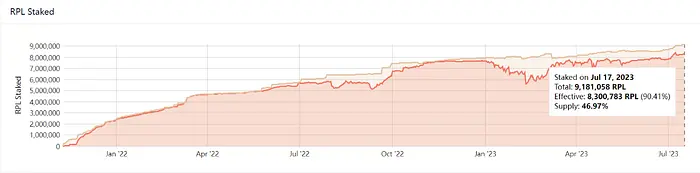
From the data dimension, RPL does not have sell-off pressure from primary market investors. Since October 2021, RPL has inflated 1.55 million tokens, but has generated 9.18 million tokens staked, resulting in a decrease in actual circulation of 7.63 million. It is predicted that, without observing a decline in RPL’s business, the purchases brought about by the protocol will continue to exceed token inflation. (For the growth of the Rocket Pool protocol, you can pay attention to the LD track weekly report.)
Disclaimer
I confirm that I have read and understood the following: The information contained in this article is strictly the opinions of the author(s). This article was authored free from any form of coercion or undue influence. The content represents the author's own views and does not represent the official position or opinions of CrossAngle. This article is intended for informational purposes only and should not be construed as investment advice or solicitation. Unless otherwise specified, all users are solely responsible and liable for their own decisions about investments, investment strategies, or the use of products or services. Investment decisions should be made based on the user’s personal investment objectives, circumstances, and financial situation. Please consult a professional financial advisor for more information and guidance. Past returns or projections do not guarantee future results.
Xangle or its affiliated partners own all copyrights of the written or otherwise produced materials and content provided on the platform. Any illegal reproduction of such content, including, but not limited to, unauthorized editing, copying, reprinting, or redistribution will result in immediate legal actions without prior notice.

![[Circulating Supply Series #2] Addressing Ongoing Circulating Supply Controversies](https://resource.xangle.io/content/thumbnails/1680/content_1680_thumbnail_f66b905b.webp)
![[Circulating Supply Series#1] Circulating Supply: The Canary in the Crypto Mine](https://resource.xangle.io/content/thumbnails/1672/content_1672_thumbnail_cf1d70cd.webp)